DSM Metainformation Layers
Additionally to the standard DSM products, SURE can optionally generate raster layers storing DSM Metainformation. These items are written as 8- 16- or 32-bit .tif images with a one-to-one correspondence to the DSM .tif tiles and they can only be generated if the DSM is also produced. The Metainformation Layers provide insights to the quality of the observations in the DSM and can be visualized and inspected in third-party GIS software.
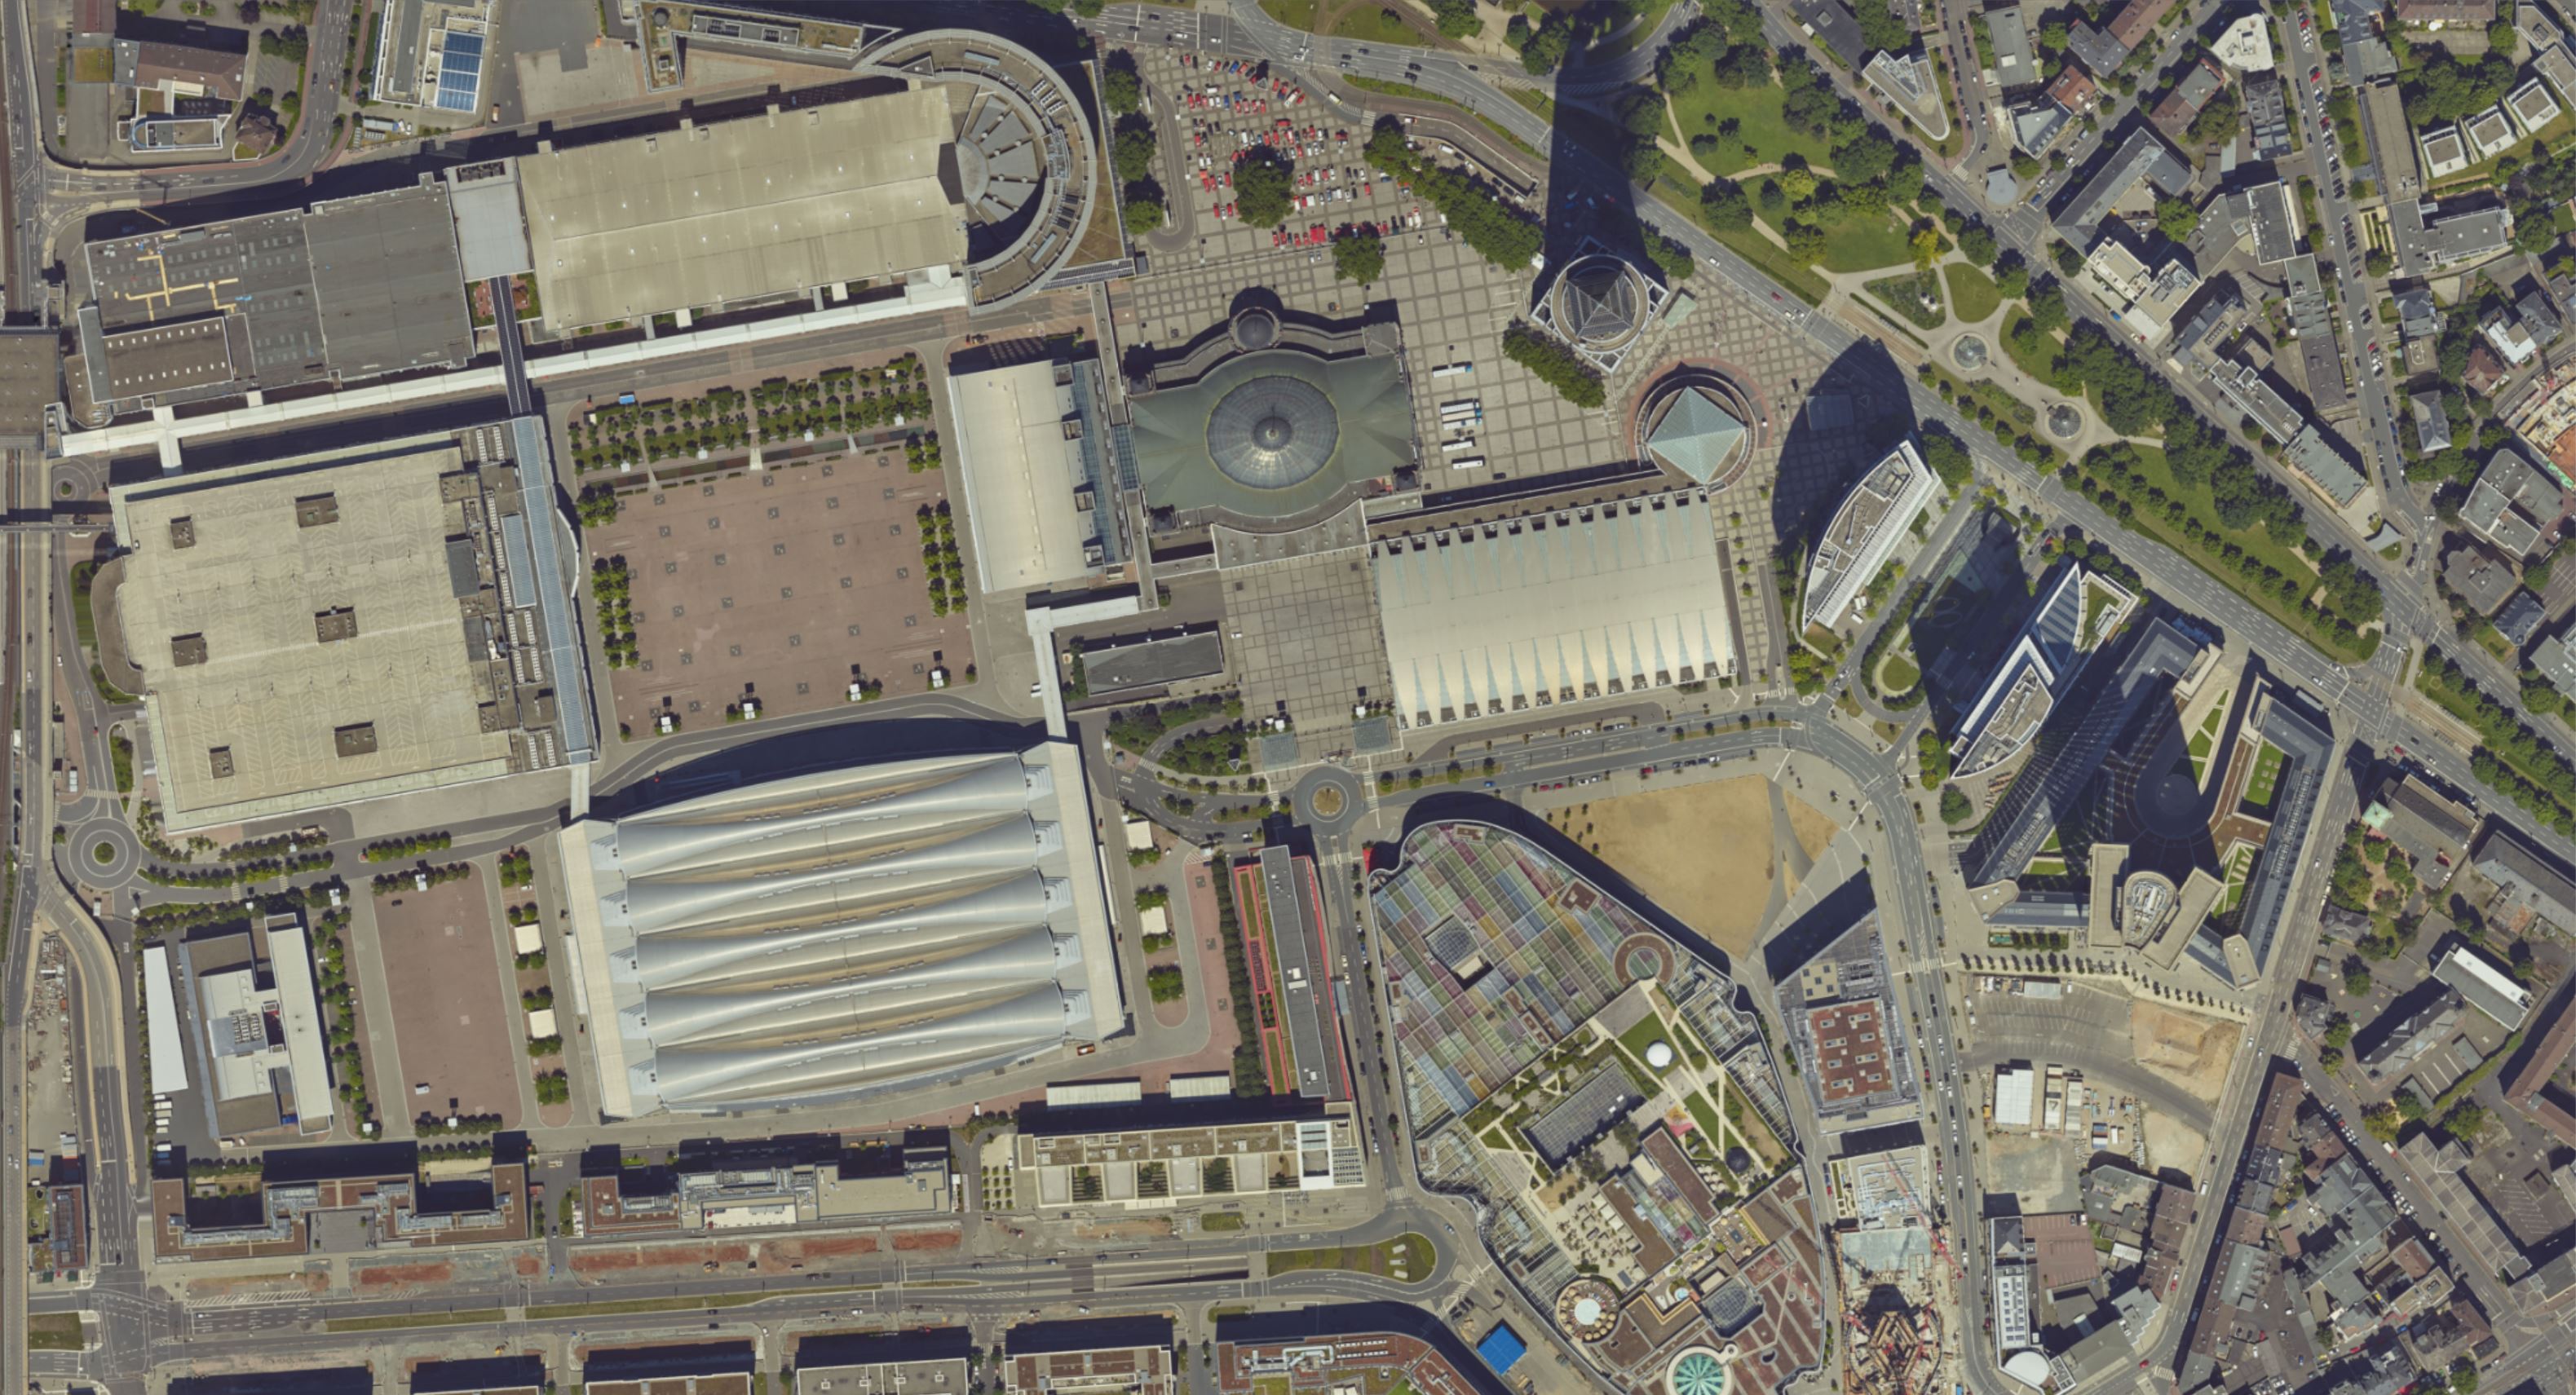
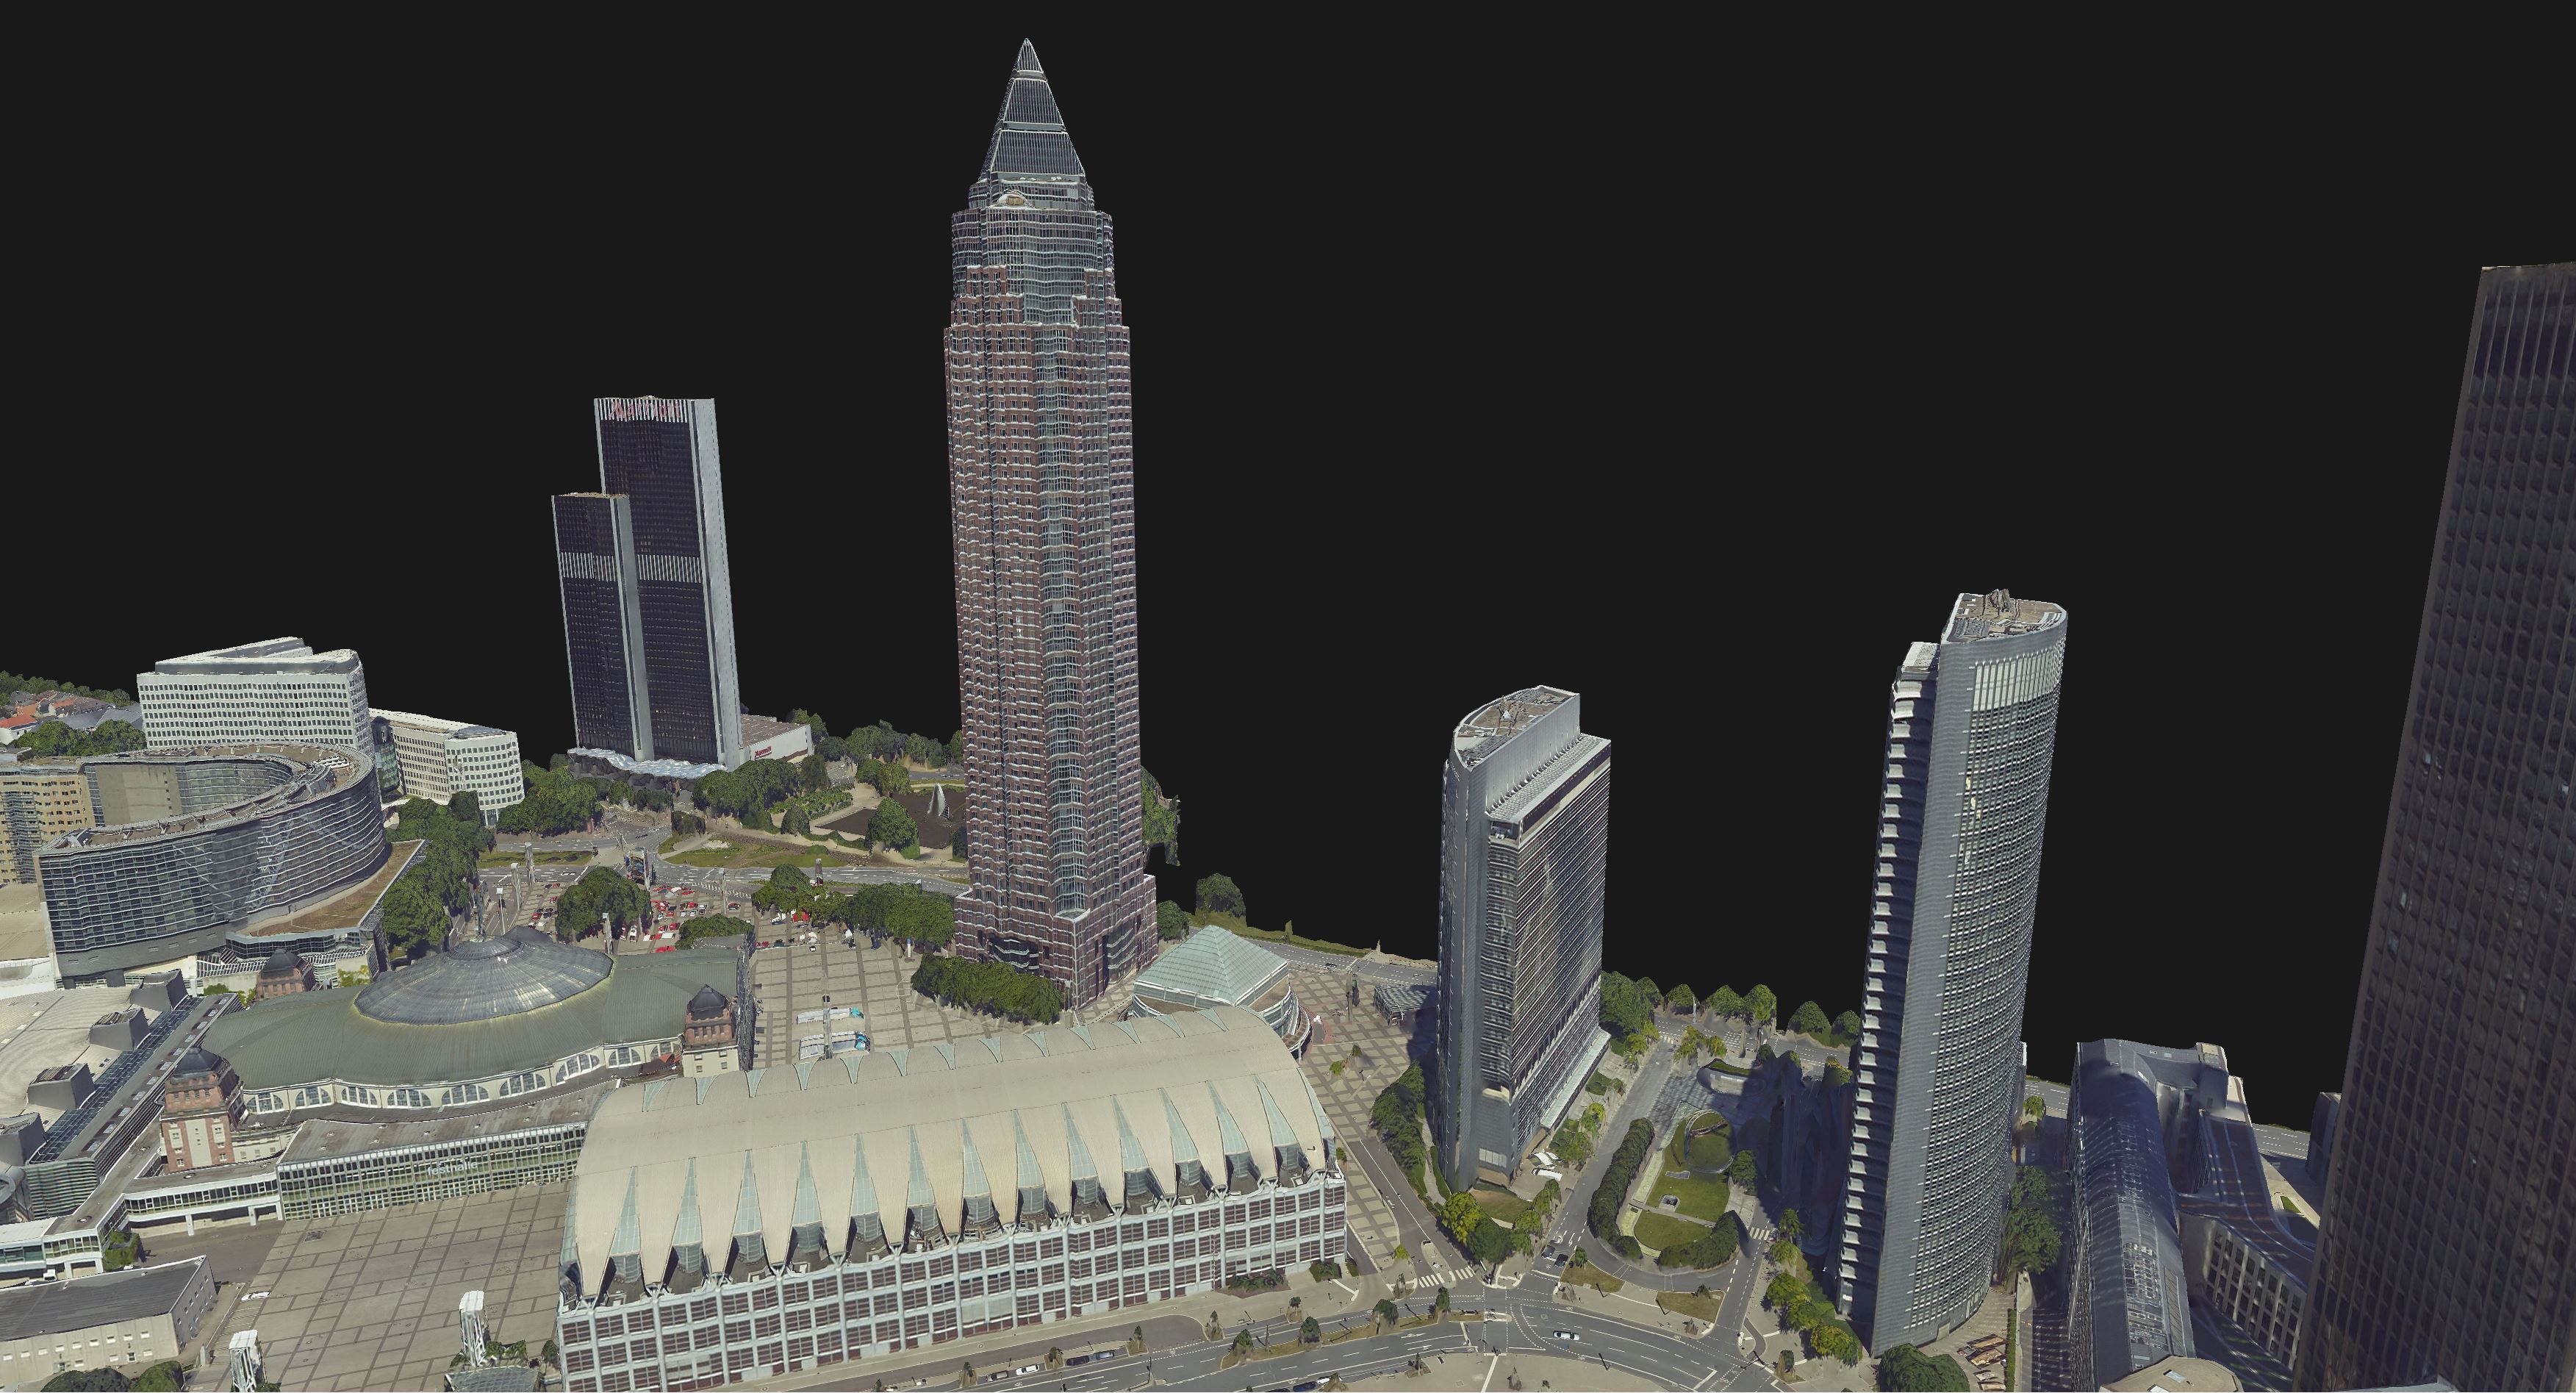
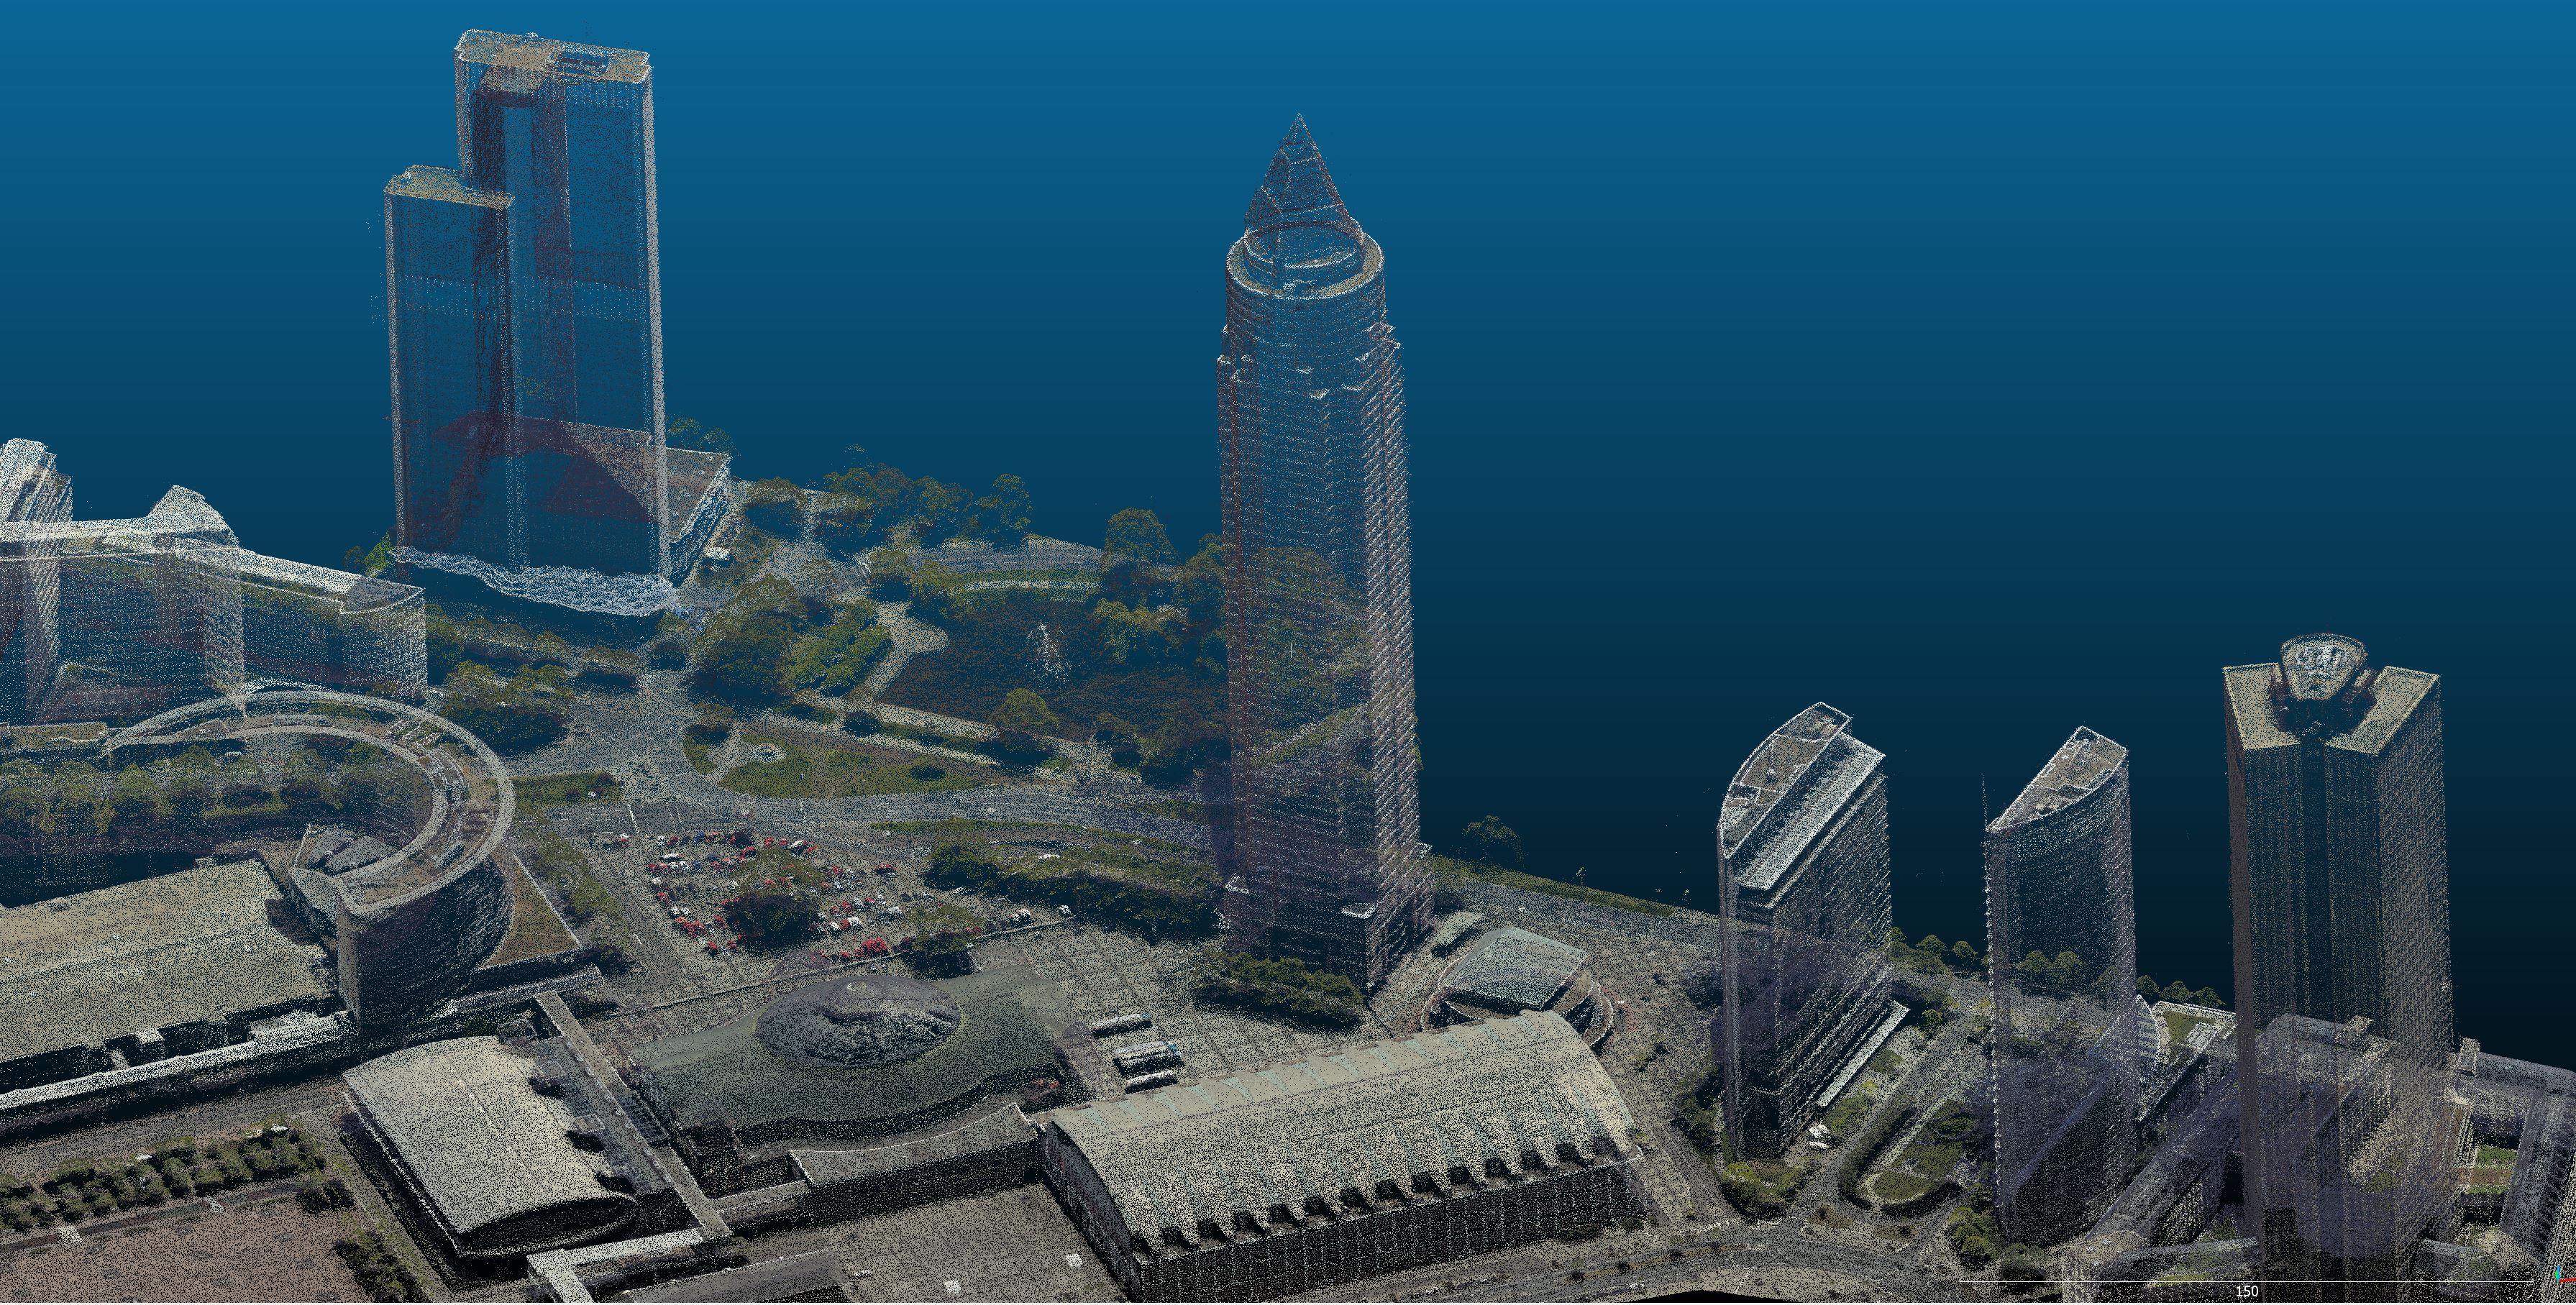
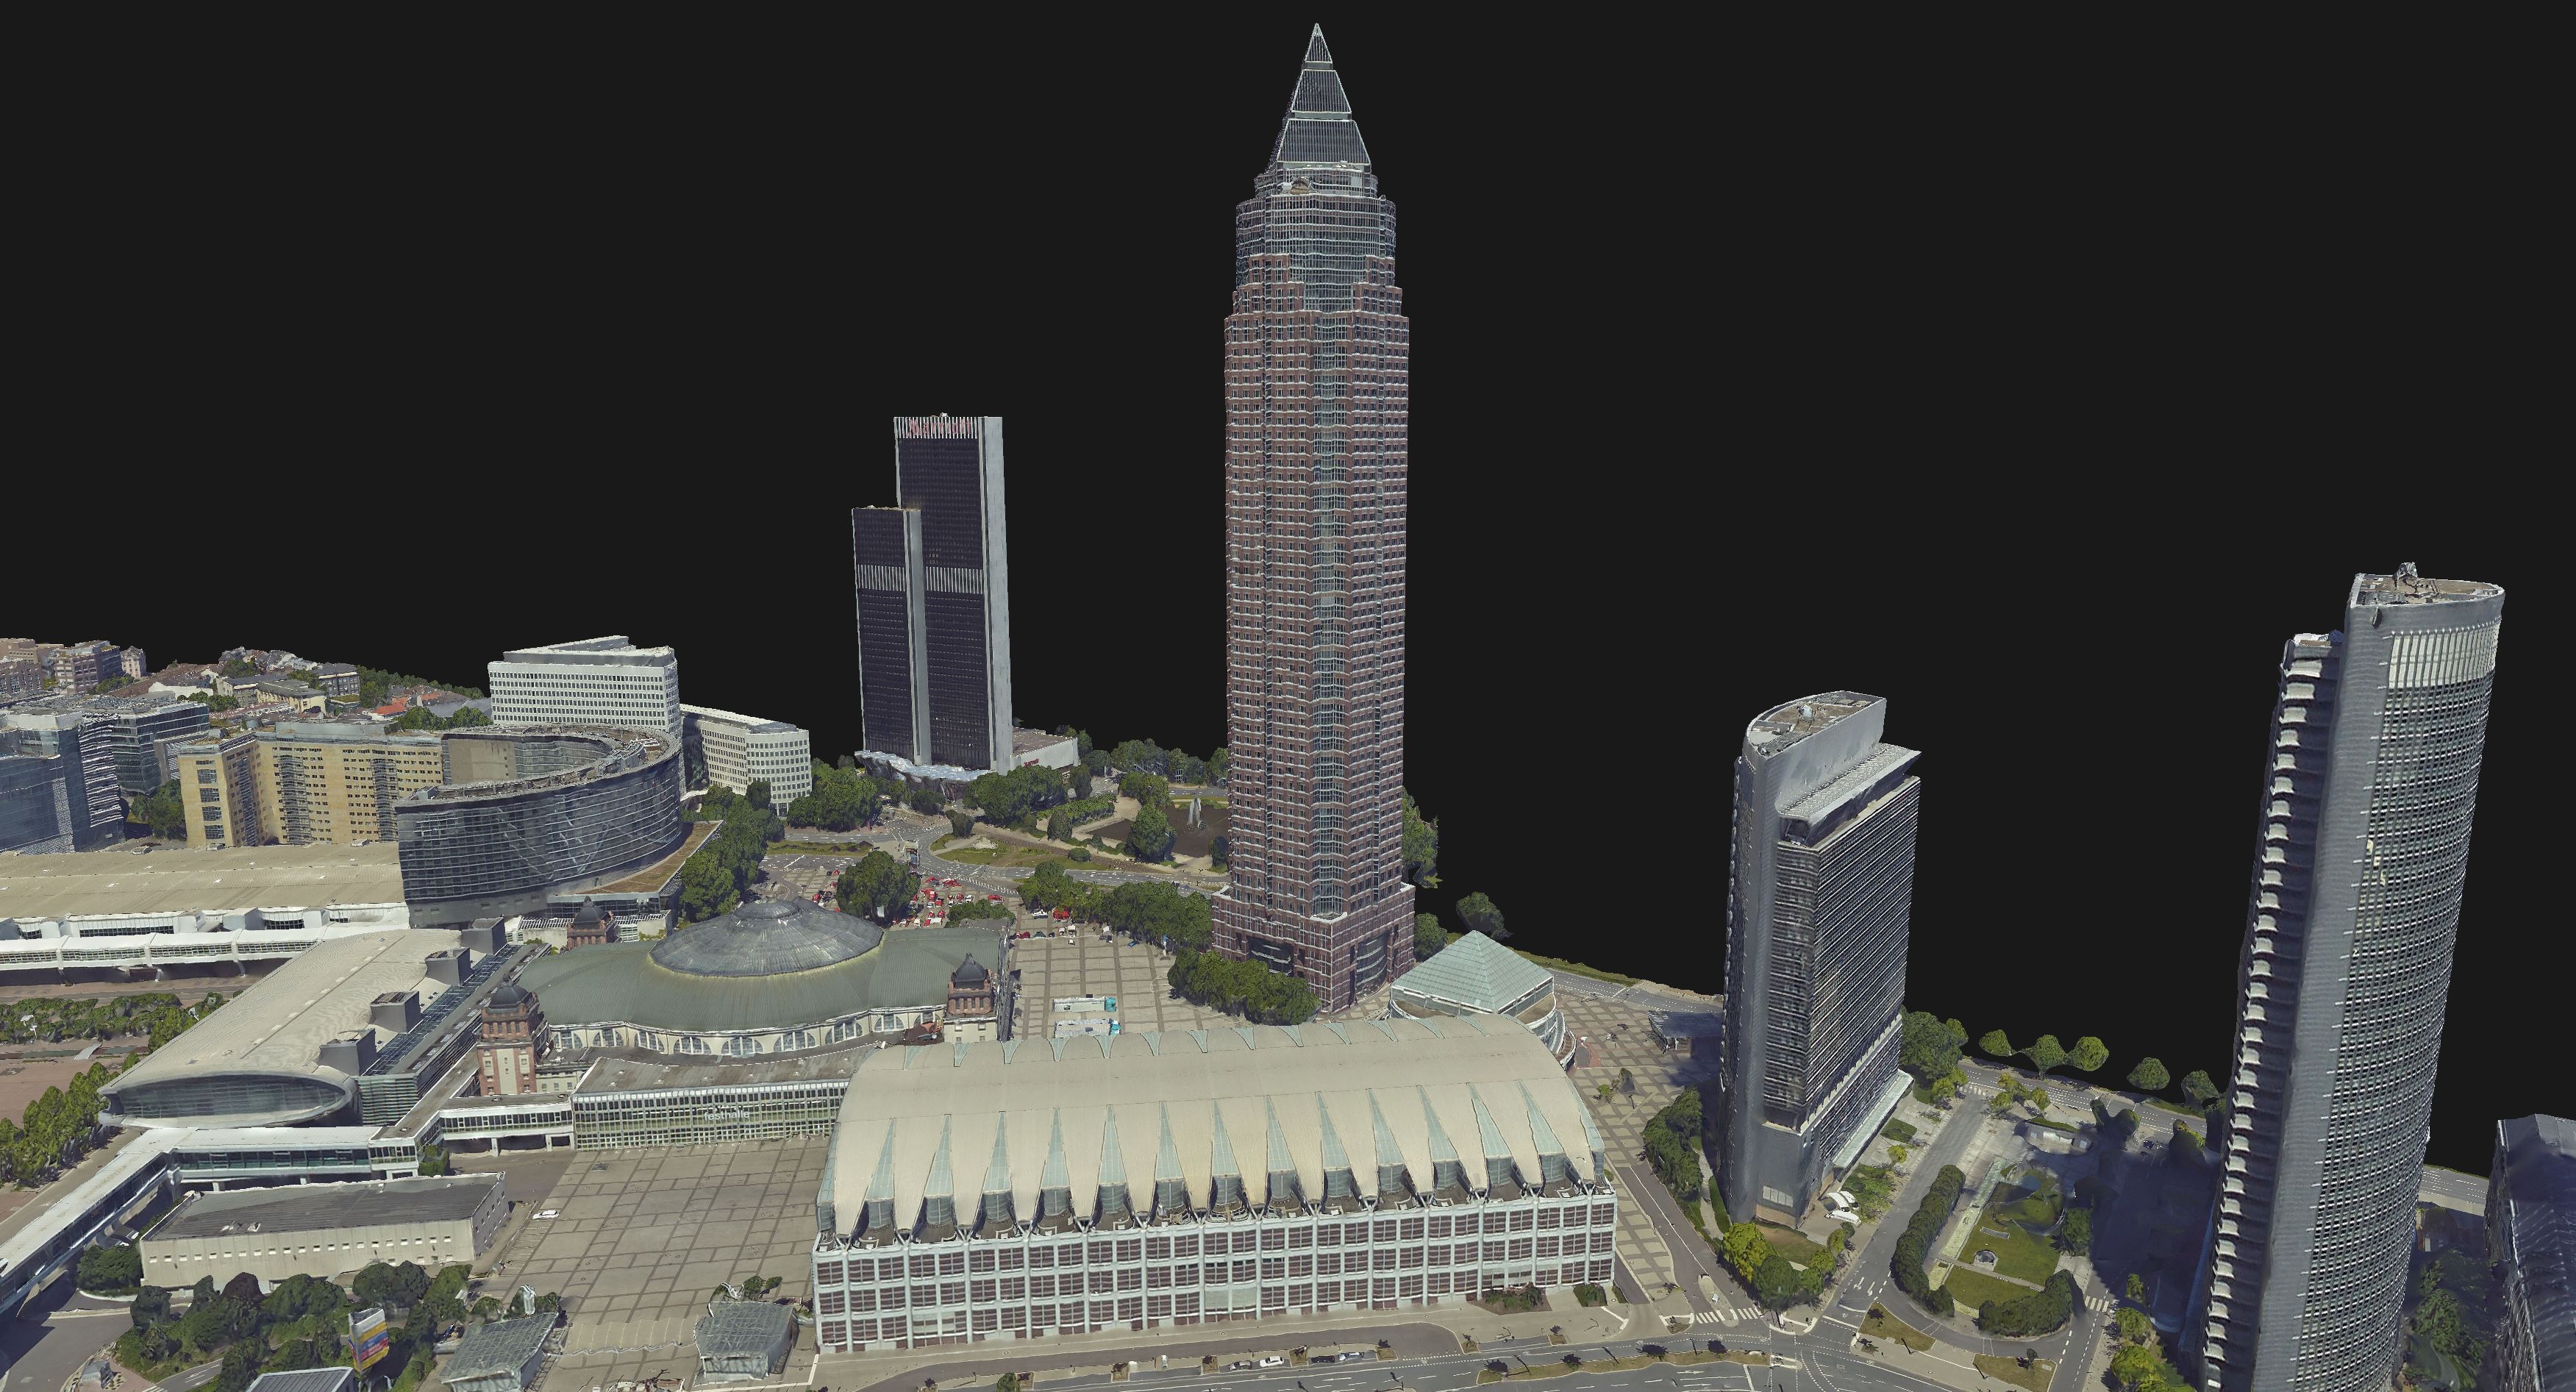
DSM Point Color
In this raster product, each pixel gets the RGB value of the original DSM point projected at the respective position.
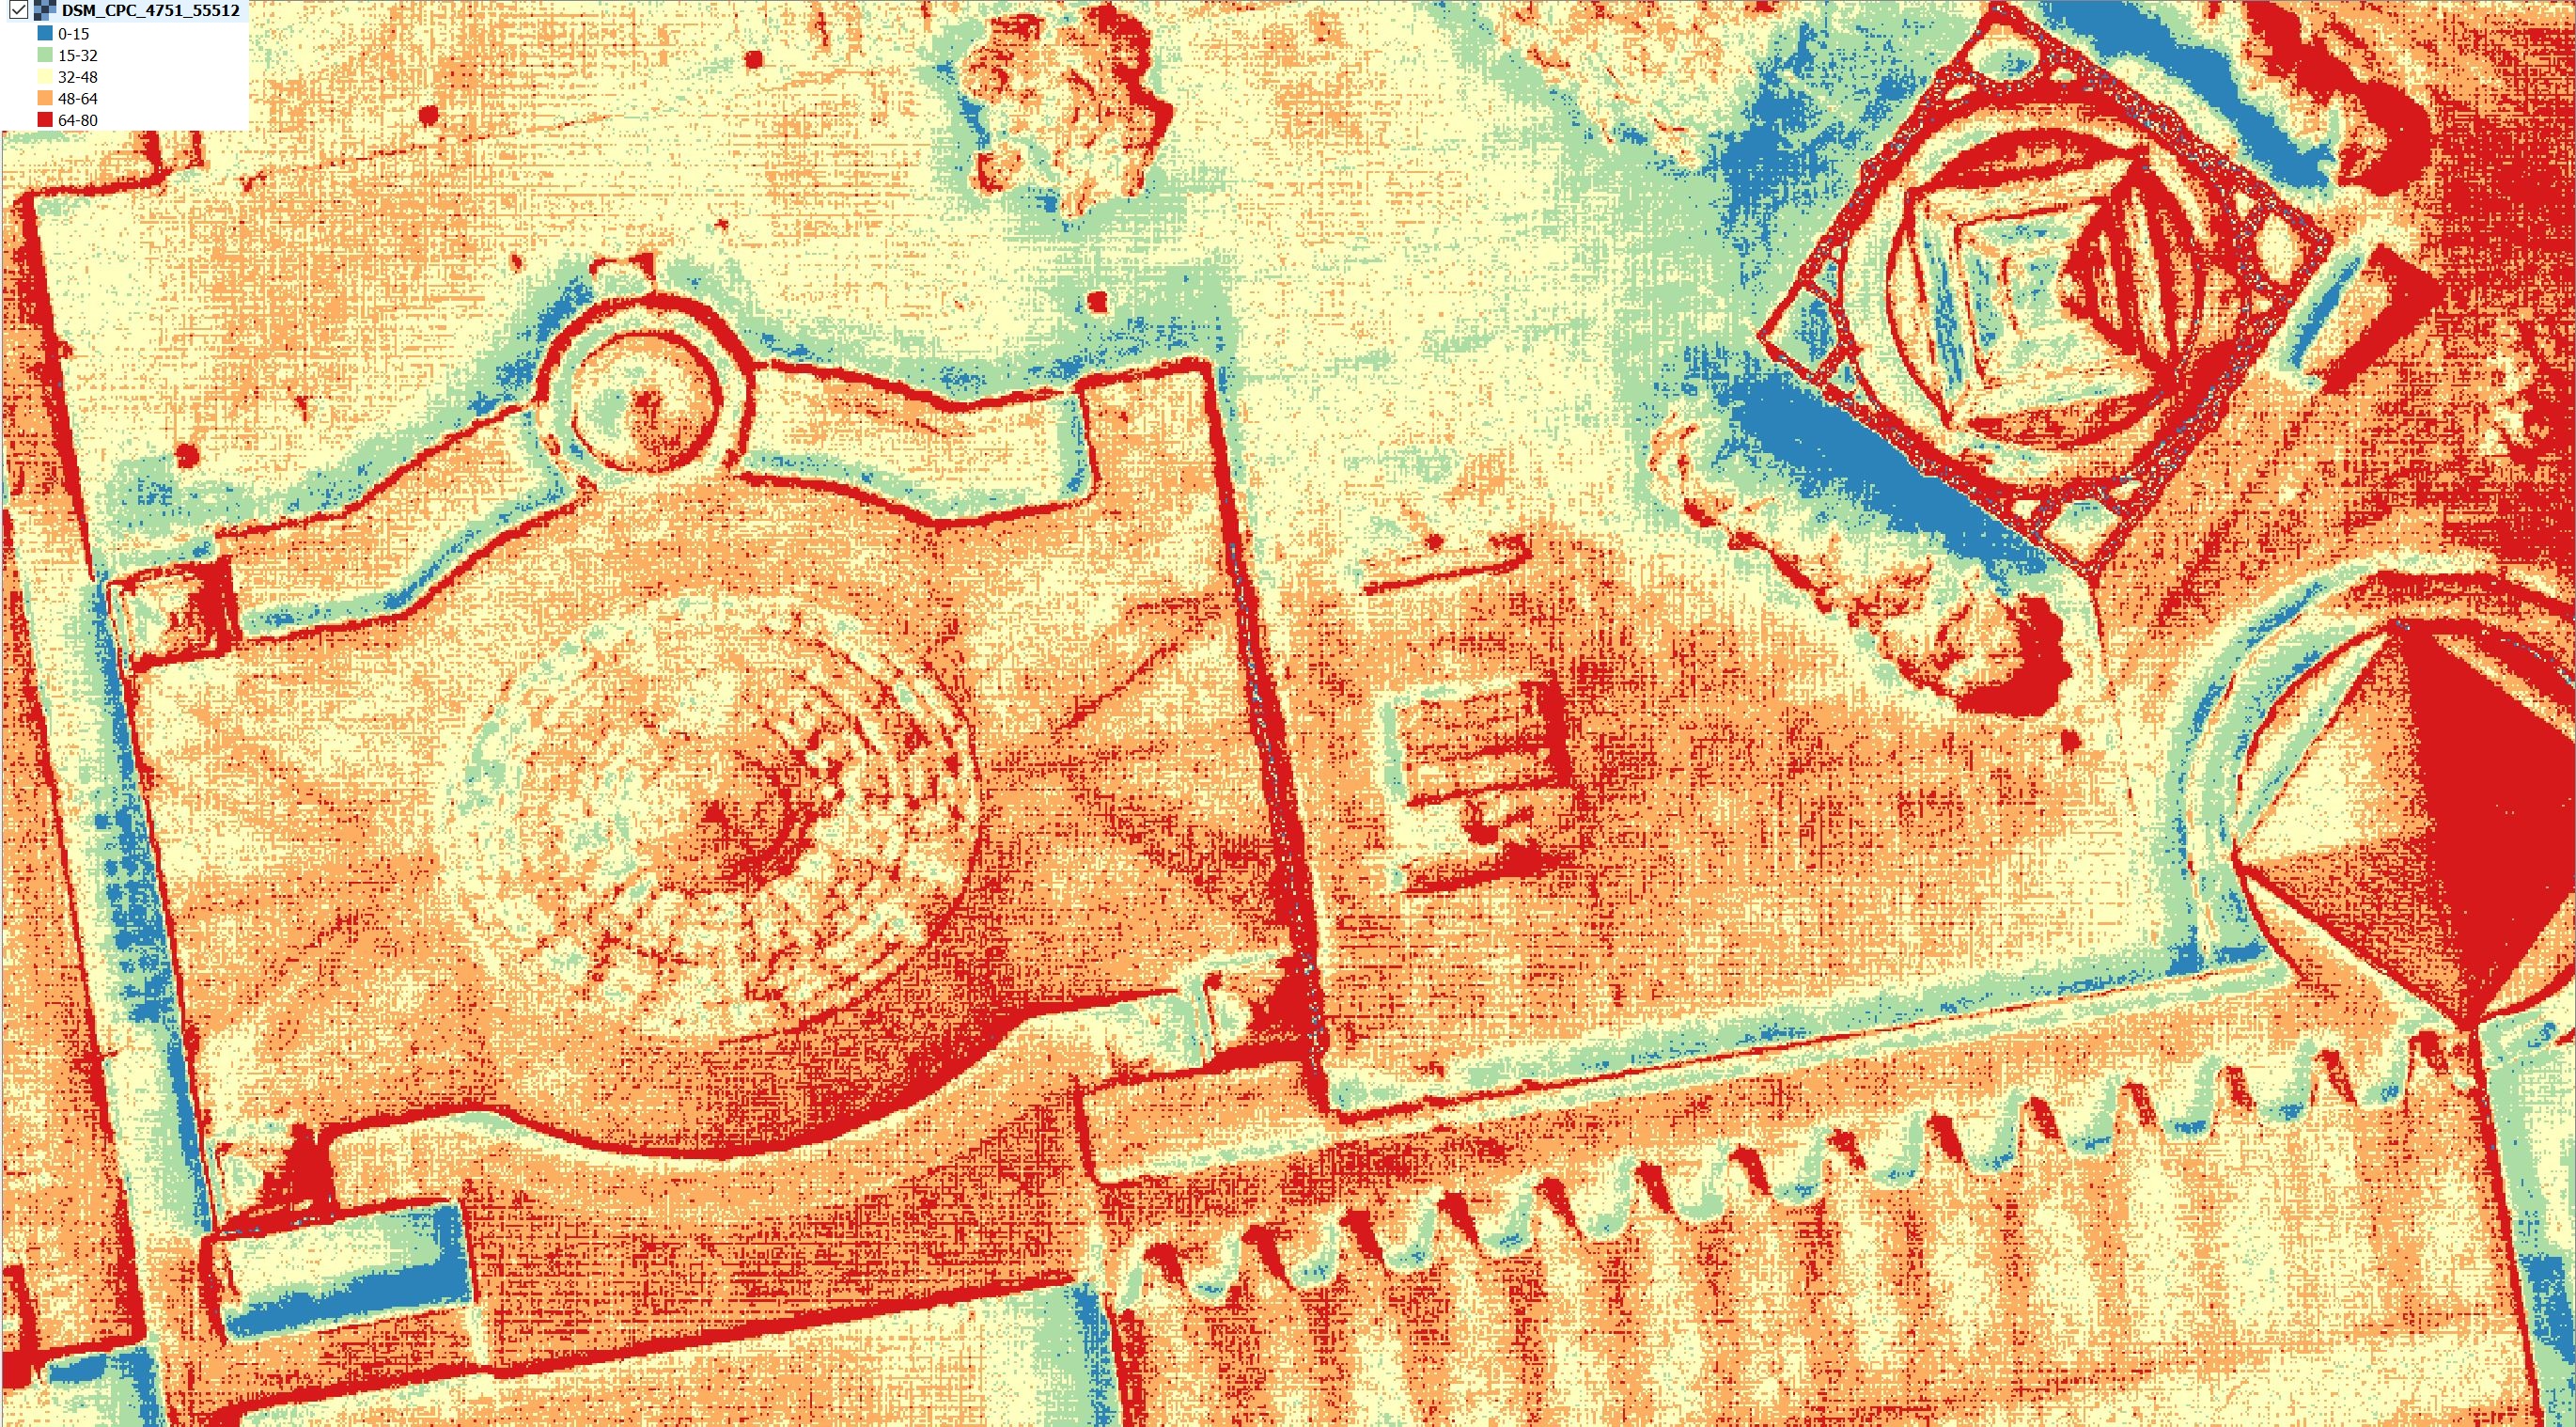
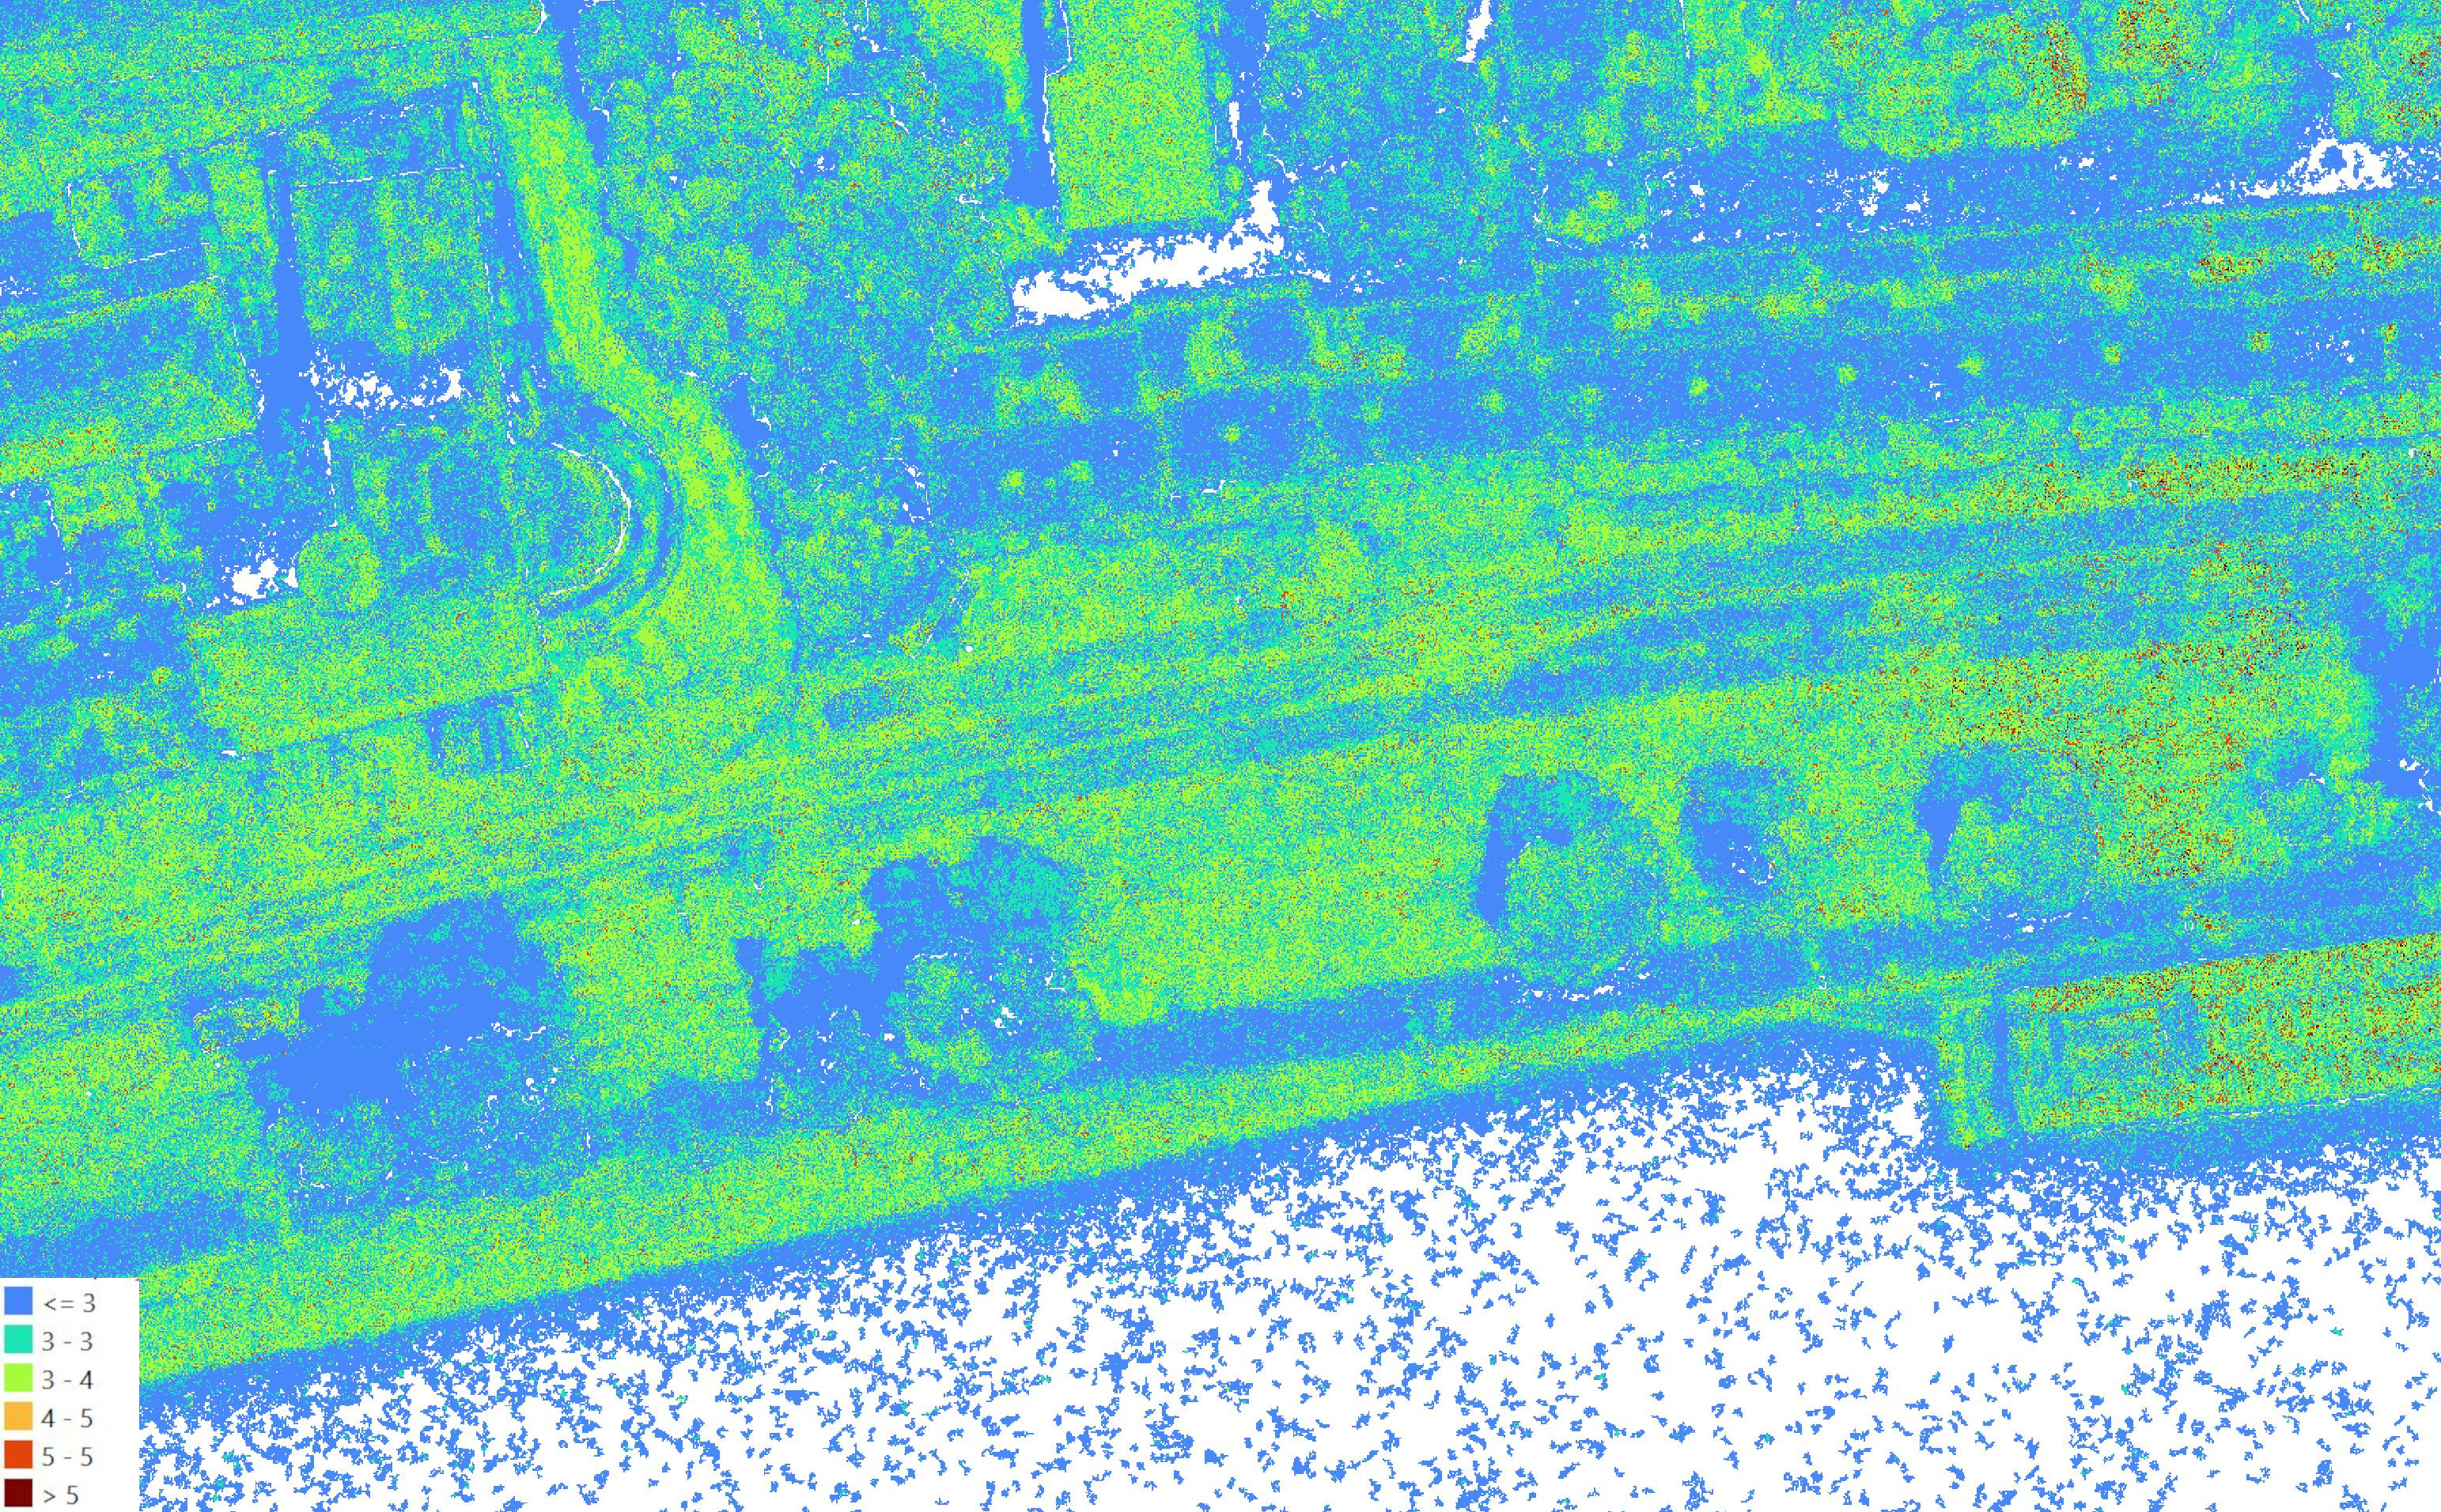
DSM Cell Point Count
Pixel values in this image reflect the number of original 3D points that were created inside the respective raster cells. The layer can be interpreted as a “visibility measure”, as it basically indicates how many input images contributed to point triangulation in the respective pixels.
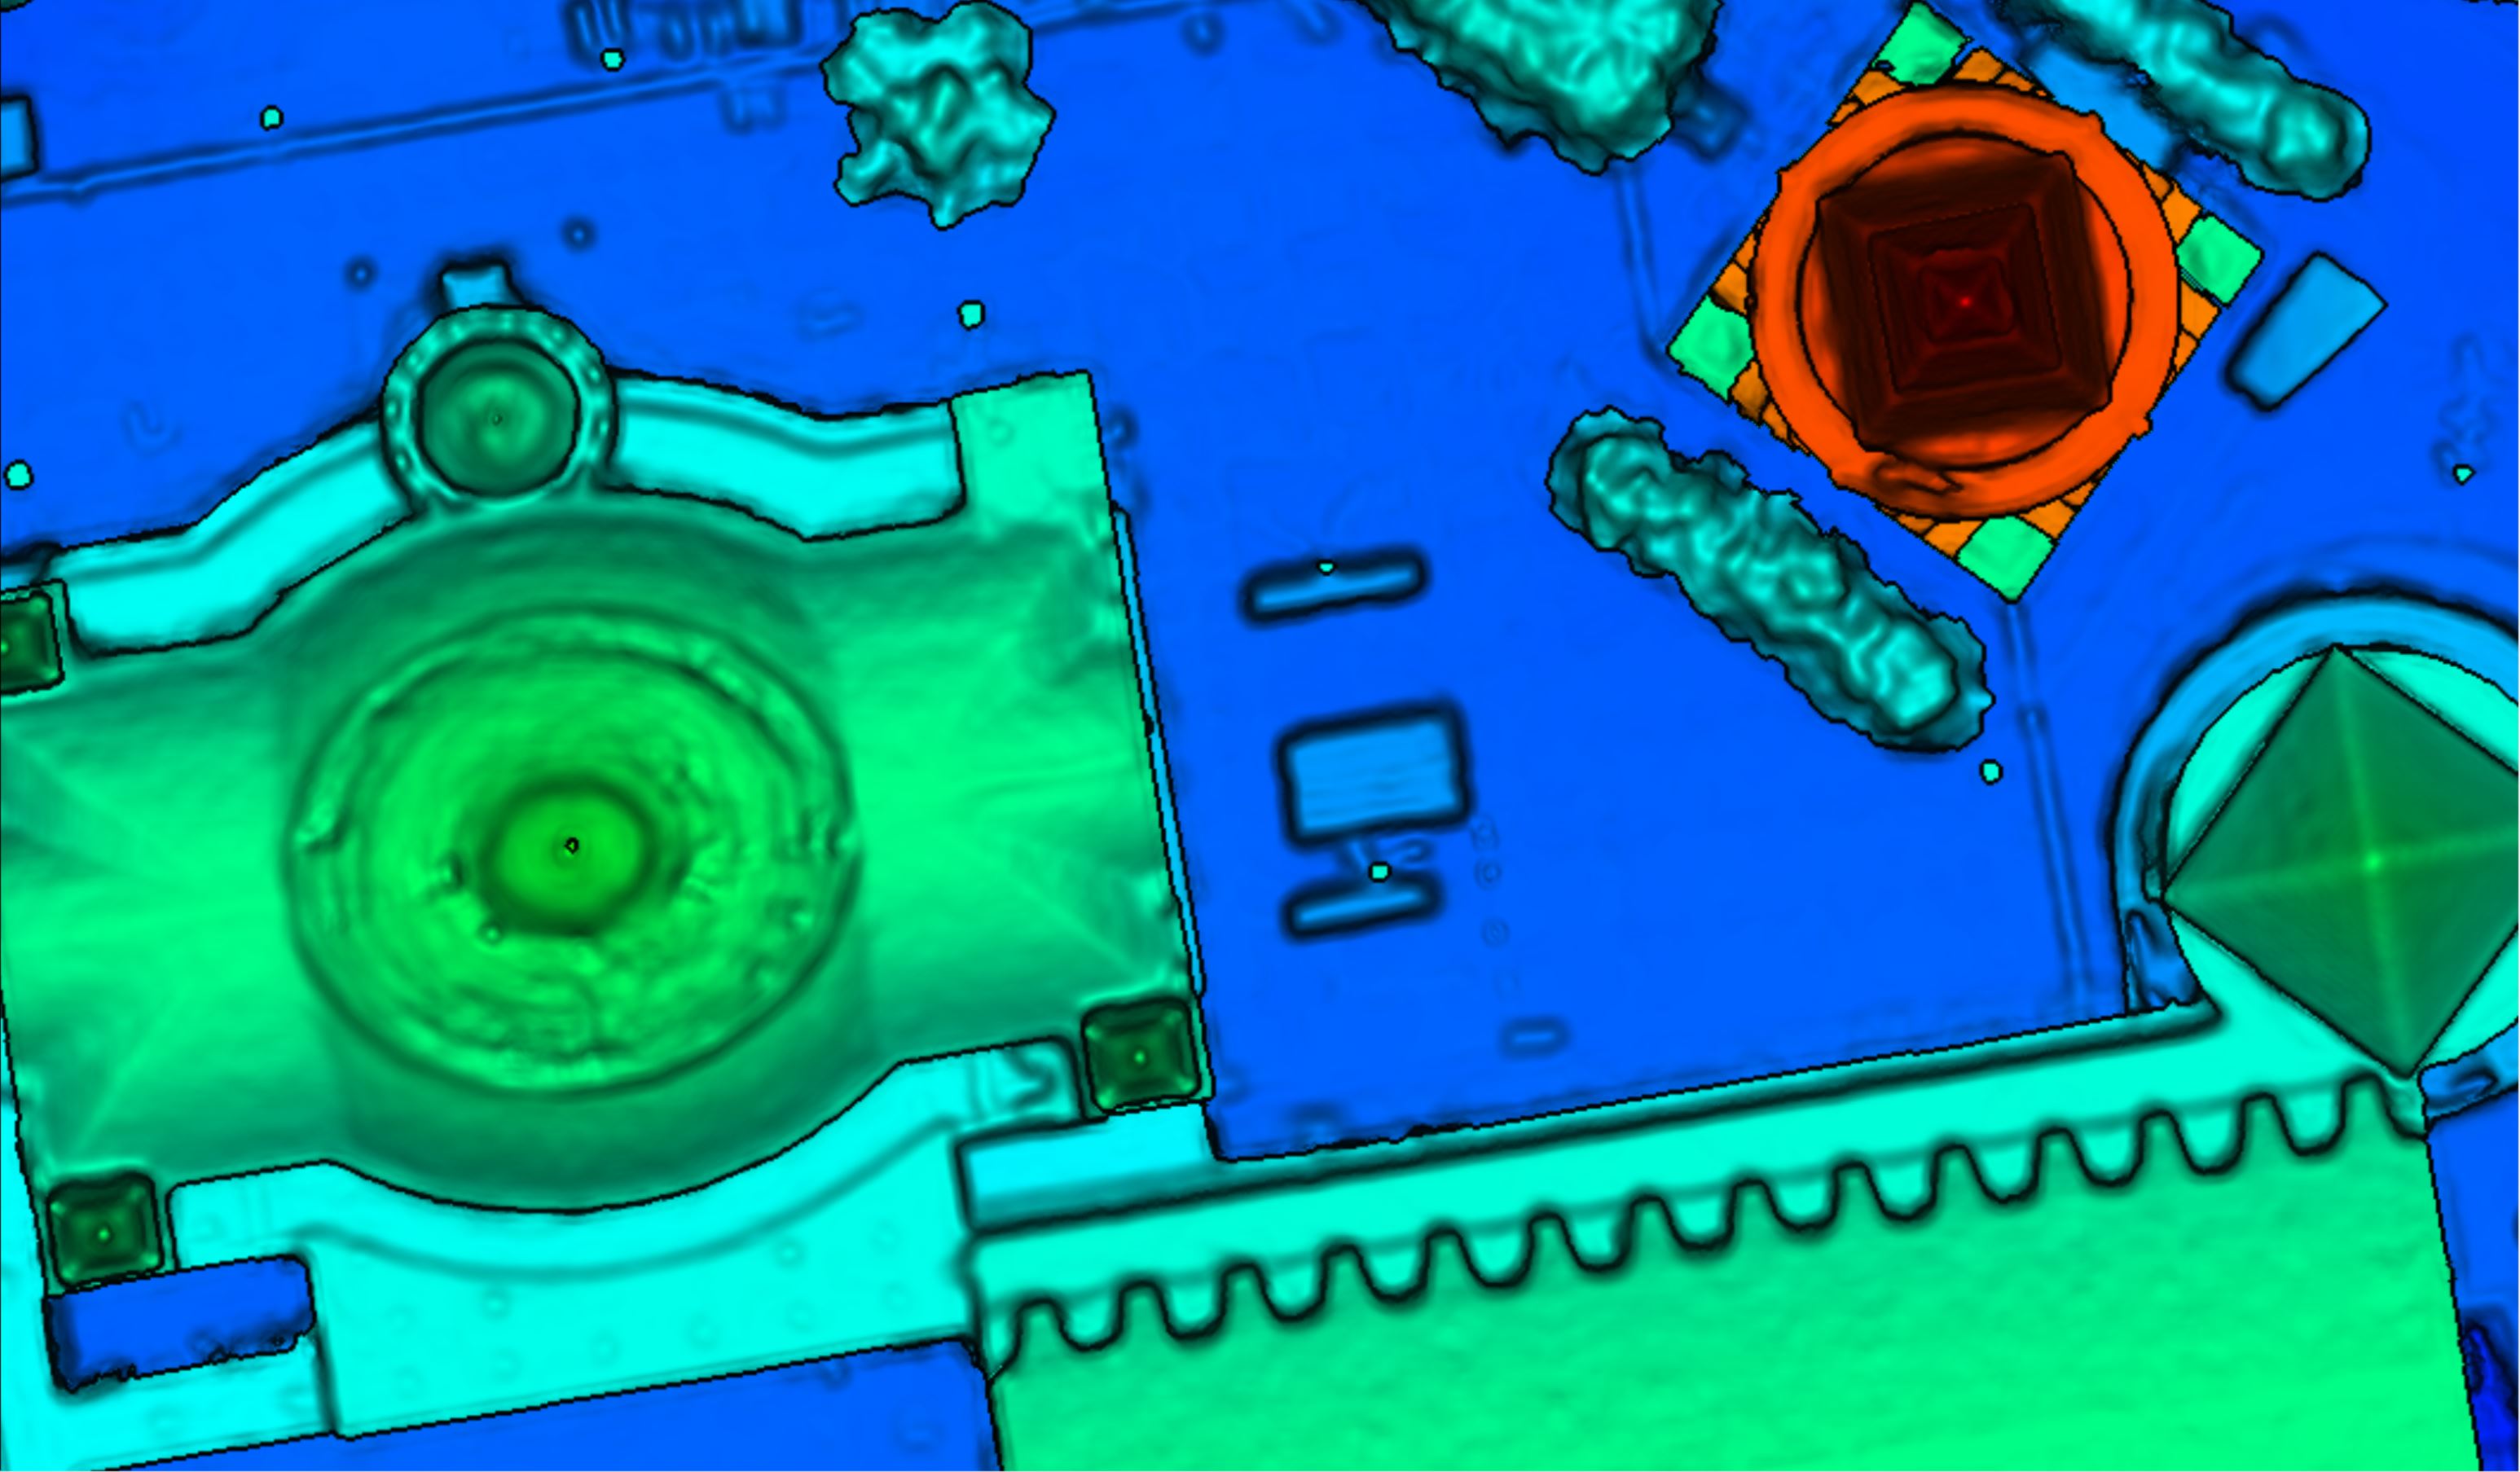
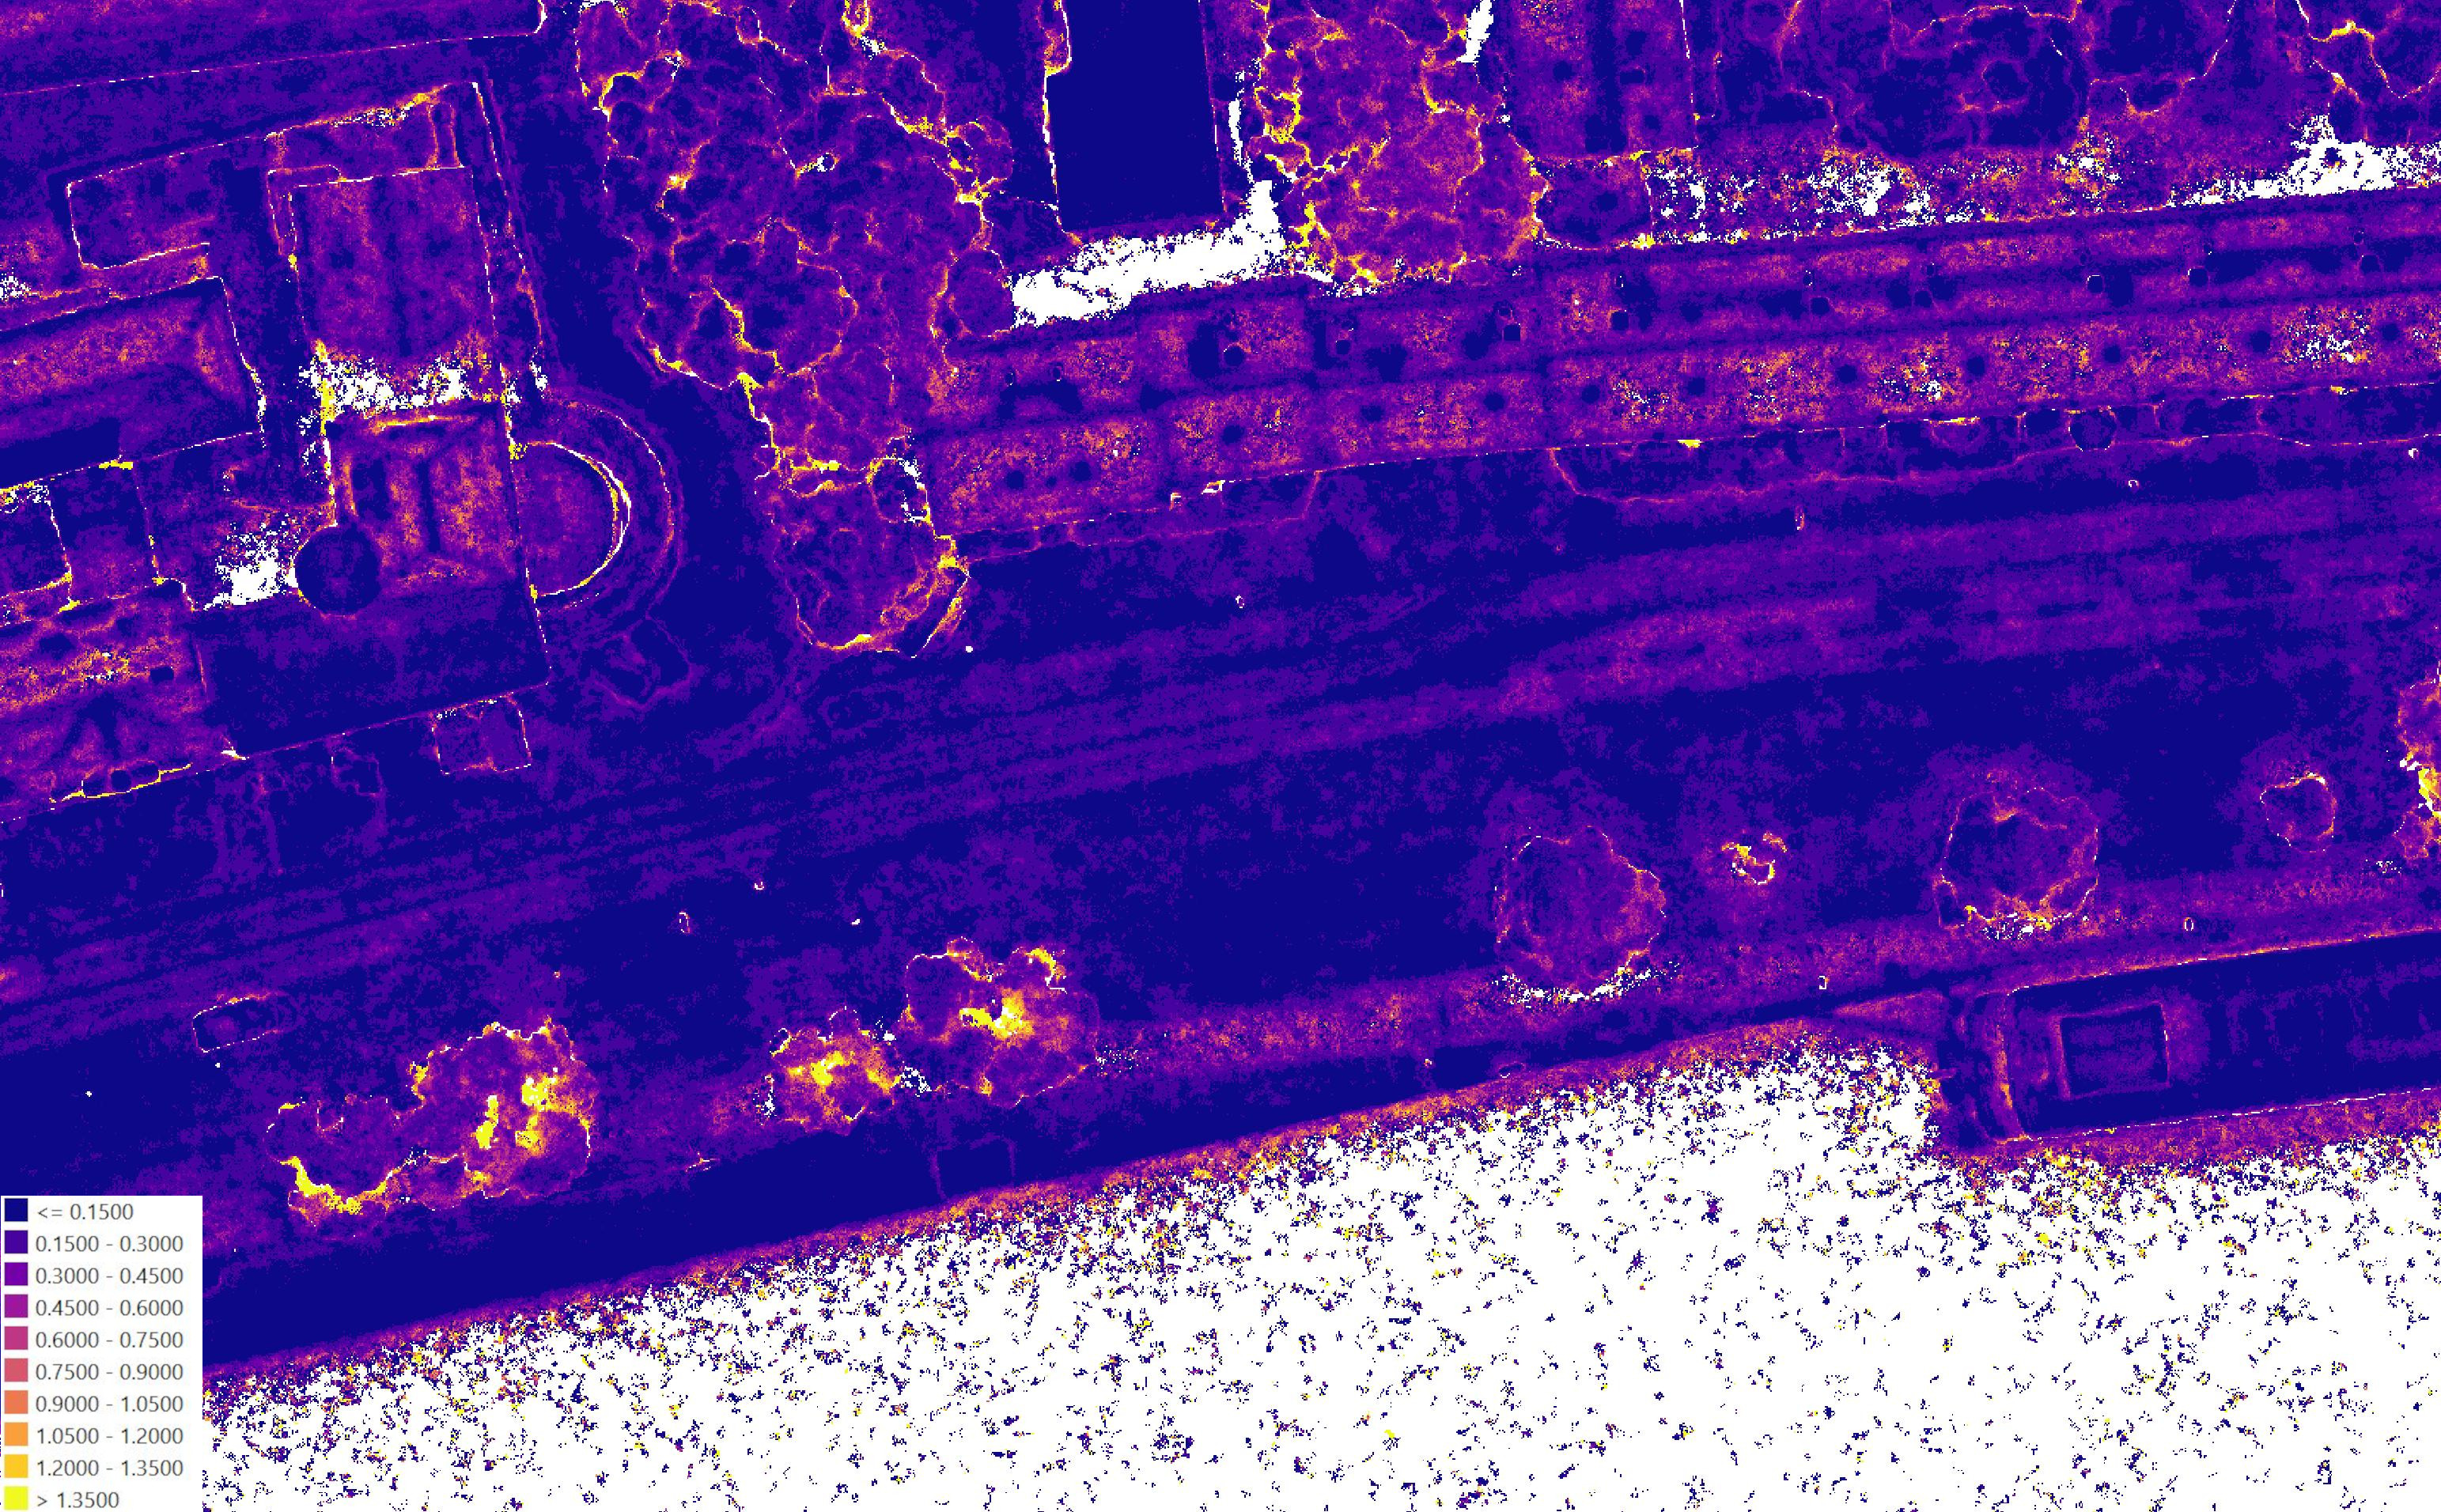
DSM Cell Standard Deviation
Each pixel stores the standard deviation value of the elevation for the points generated inside the respective raster cell. It can be a good indicator of the reliability of the z-value corresponding in the DSM product.
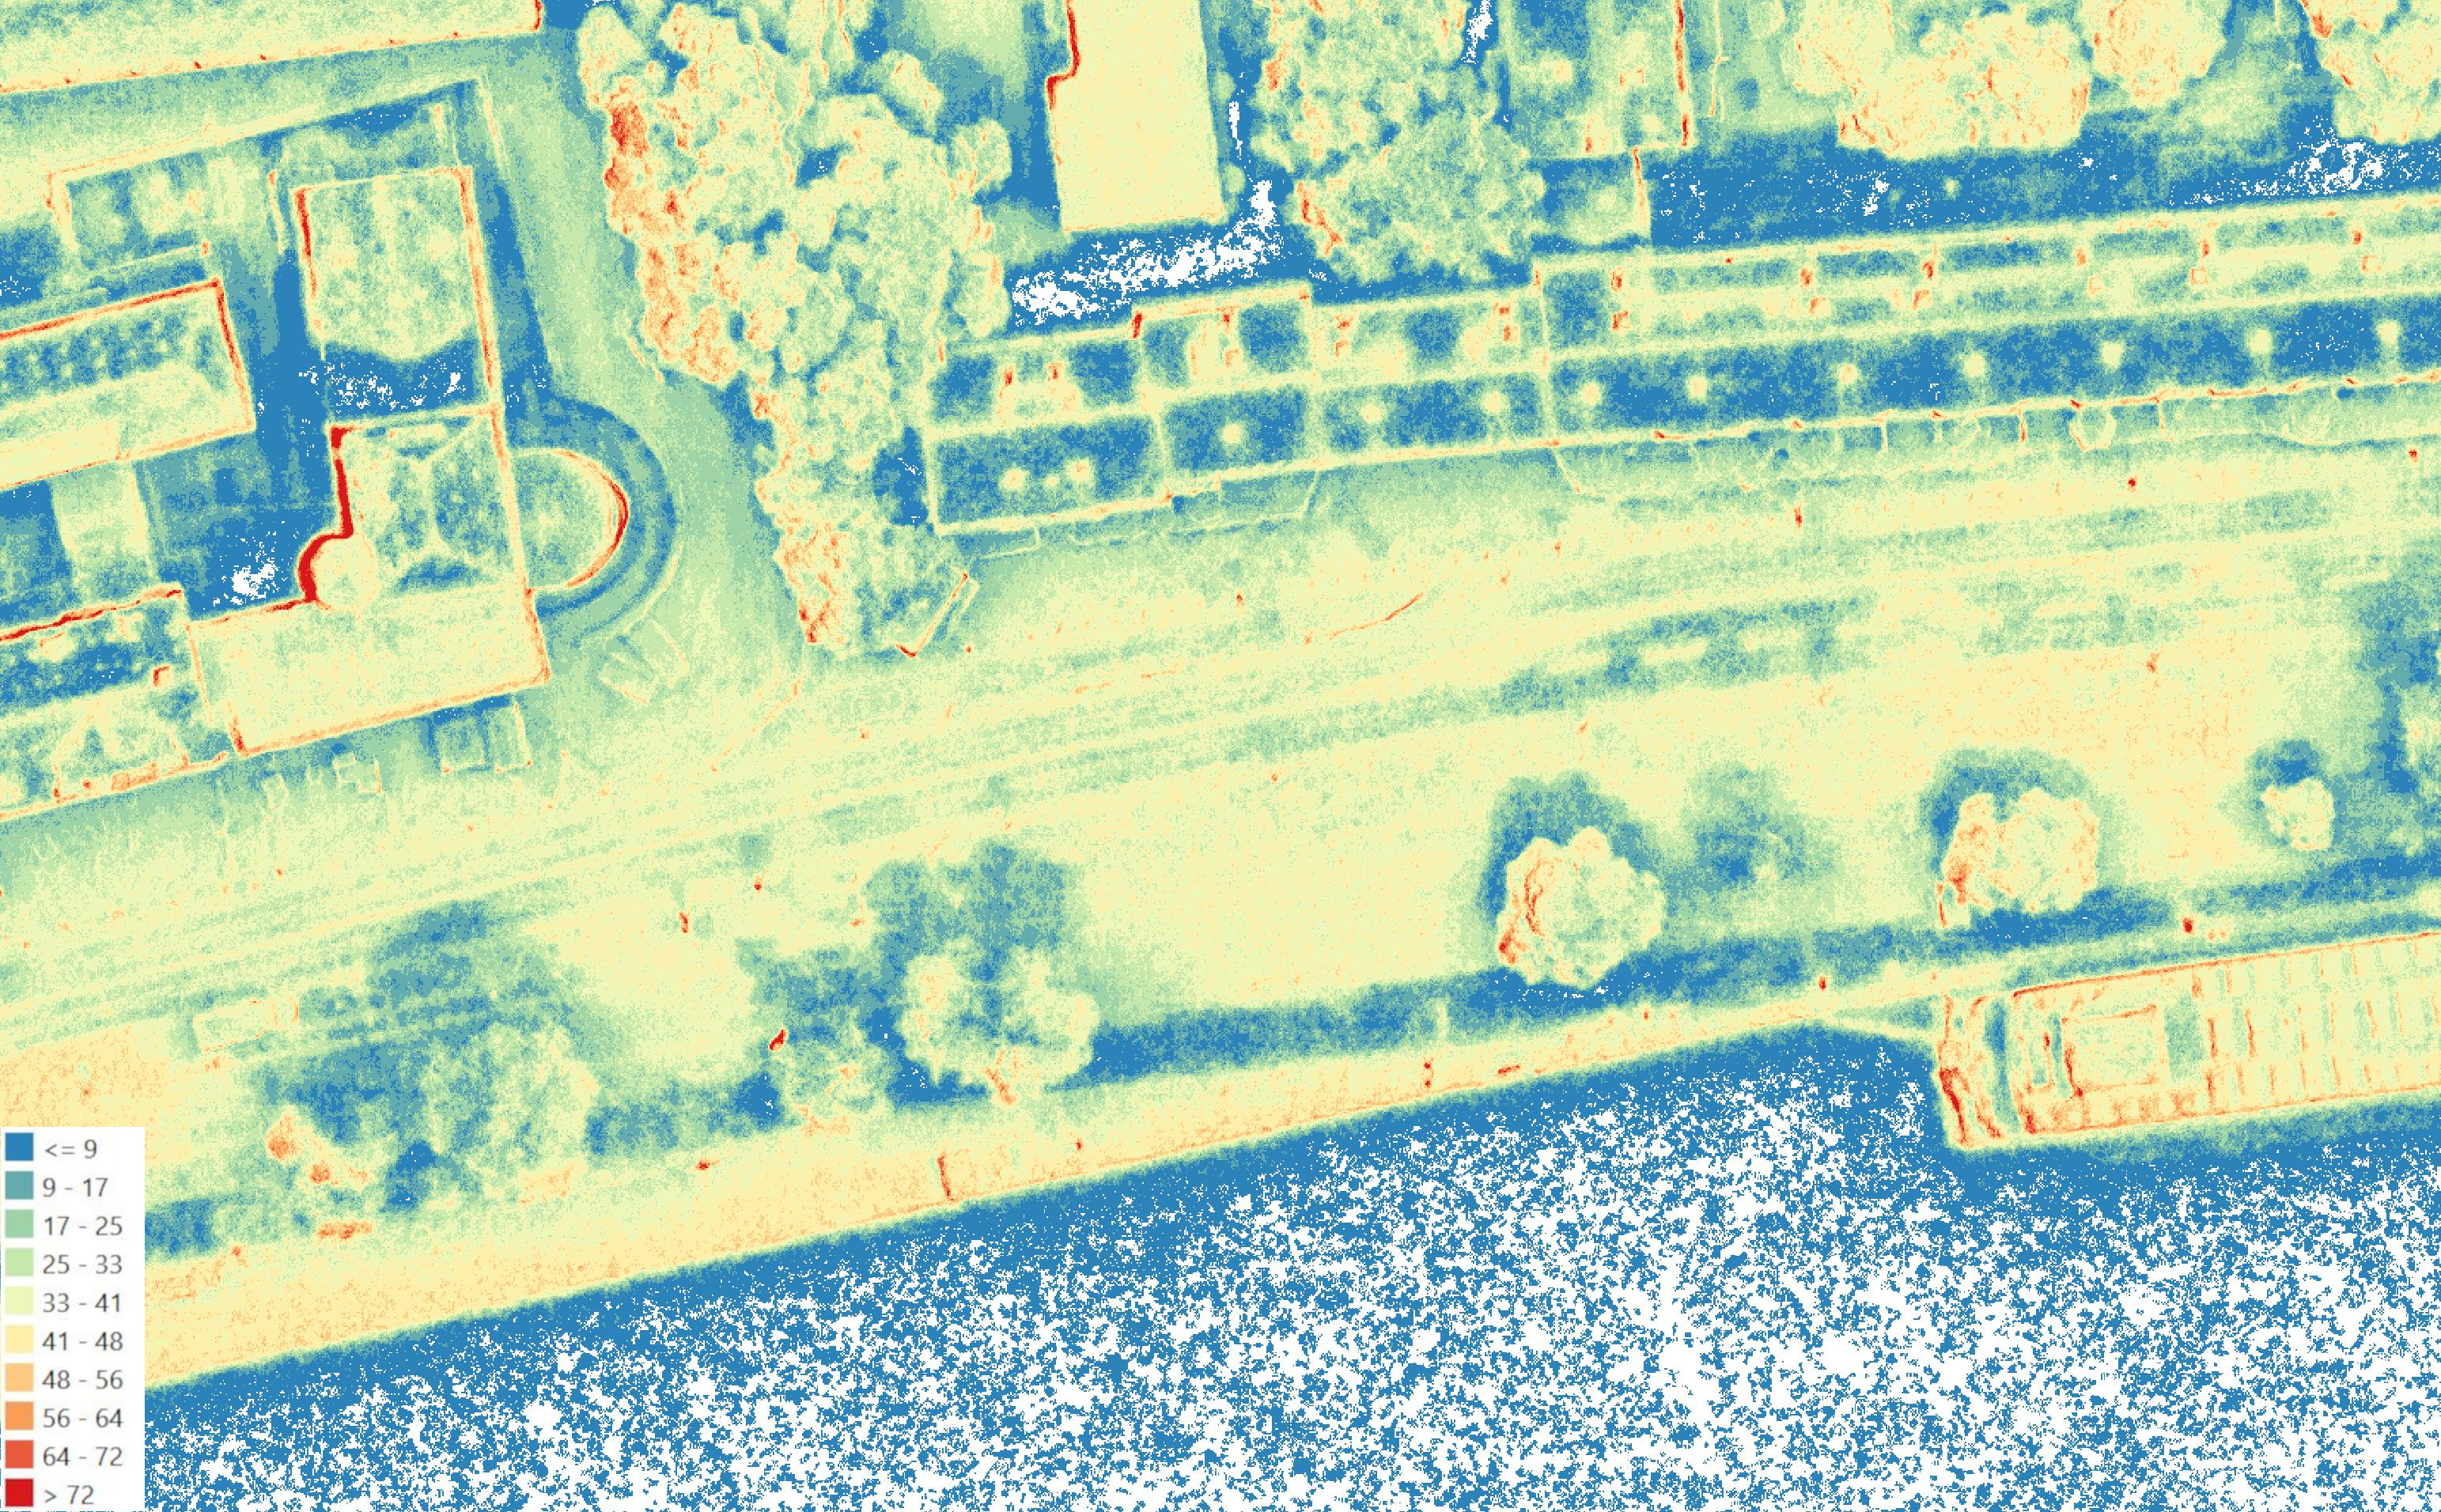
DSM Model Count
Each pixel stores the number of stereo models participating in the 3D point triangulation from which the elevation measurements in the DSM were taken.
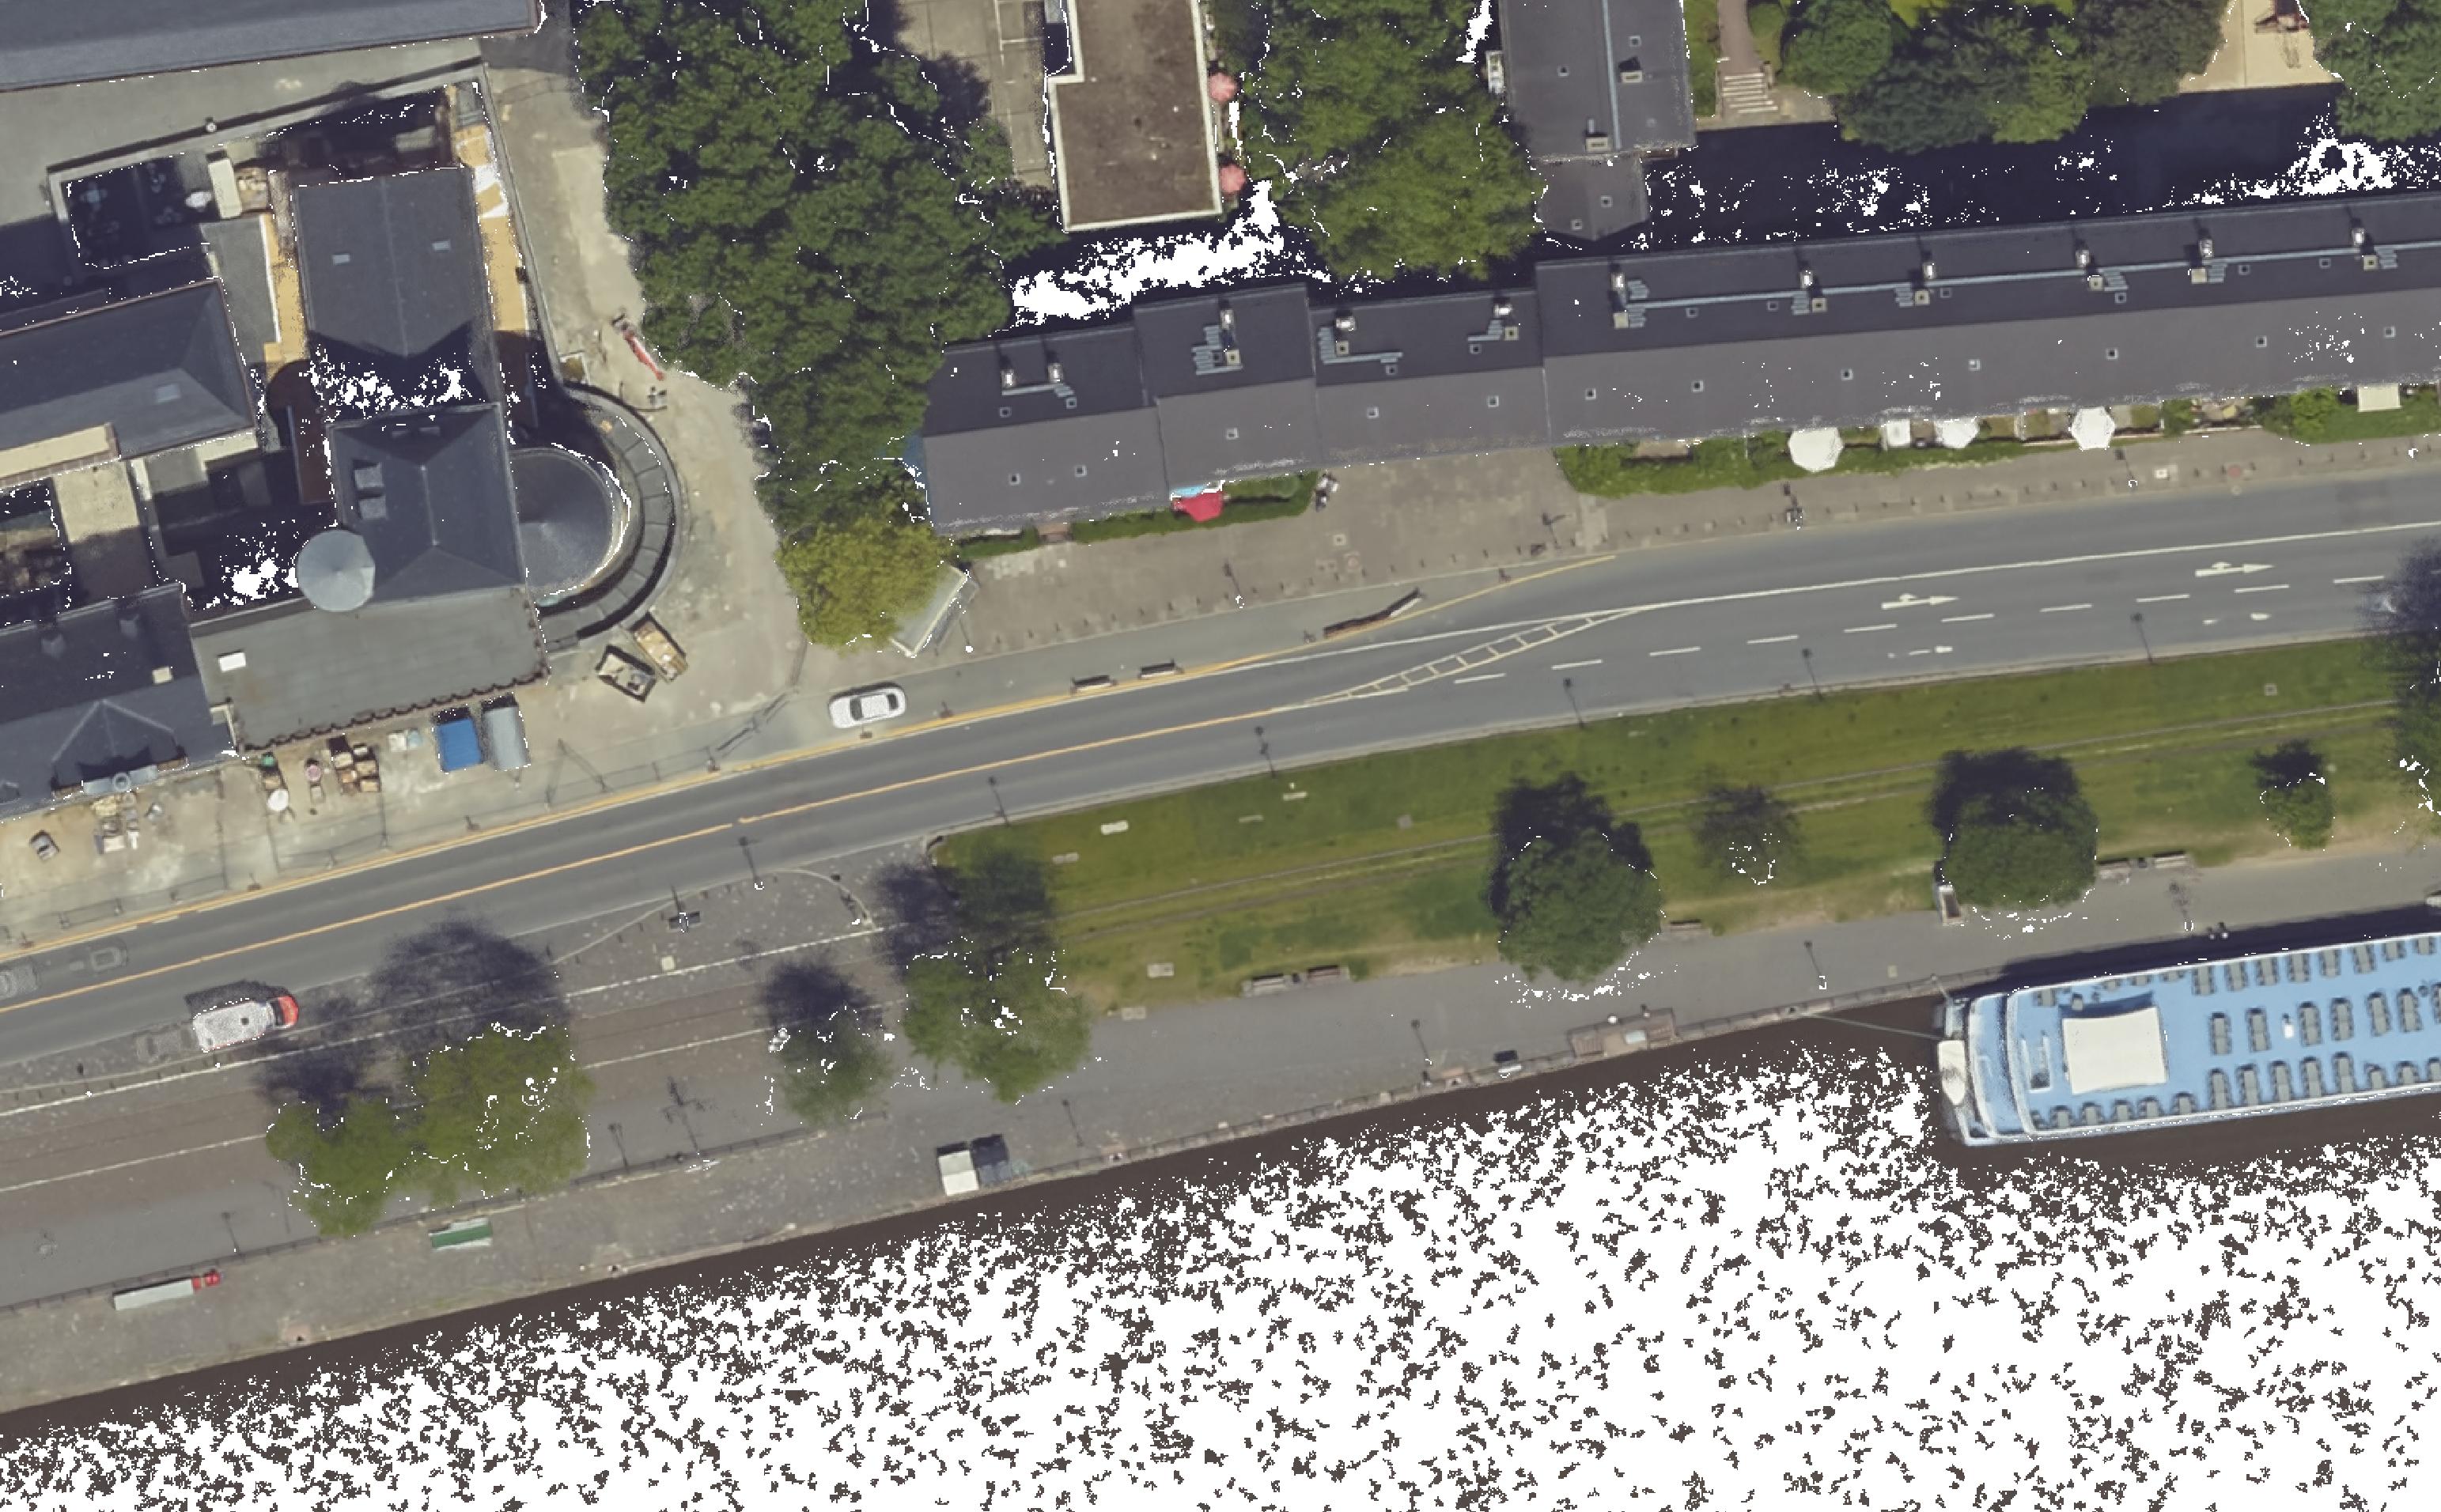
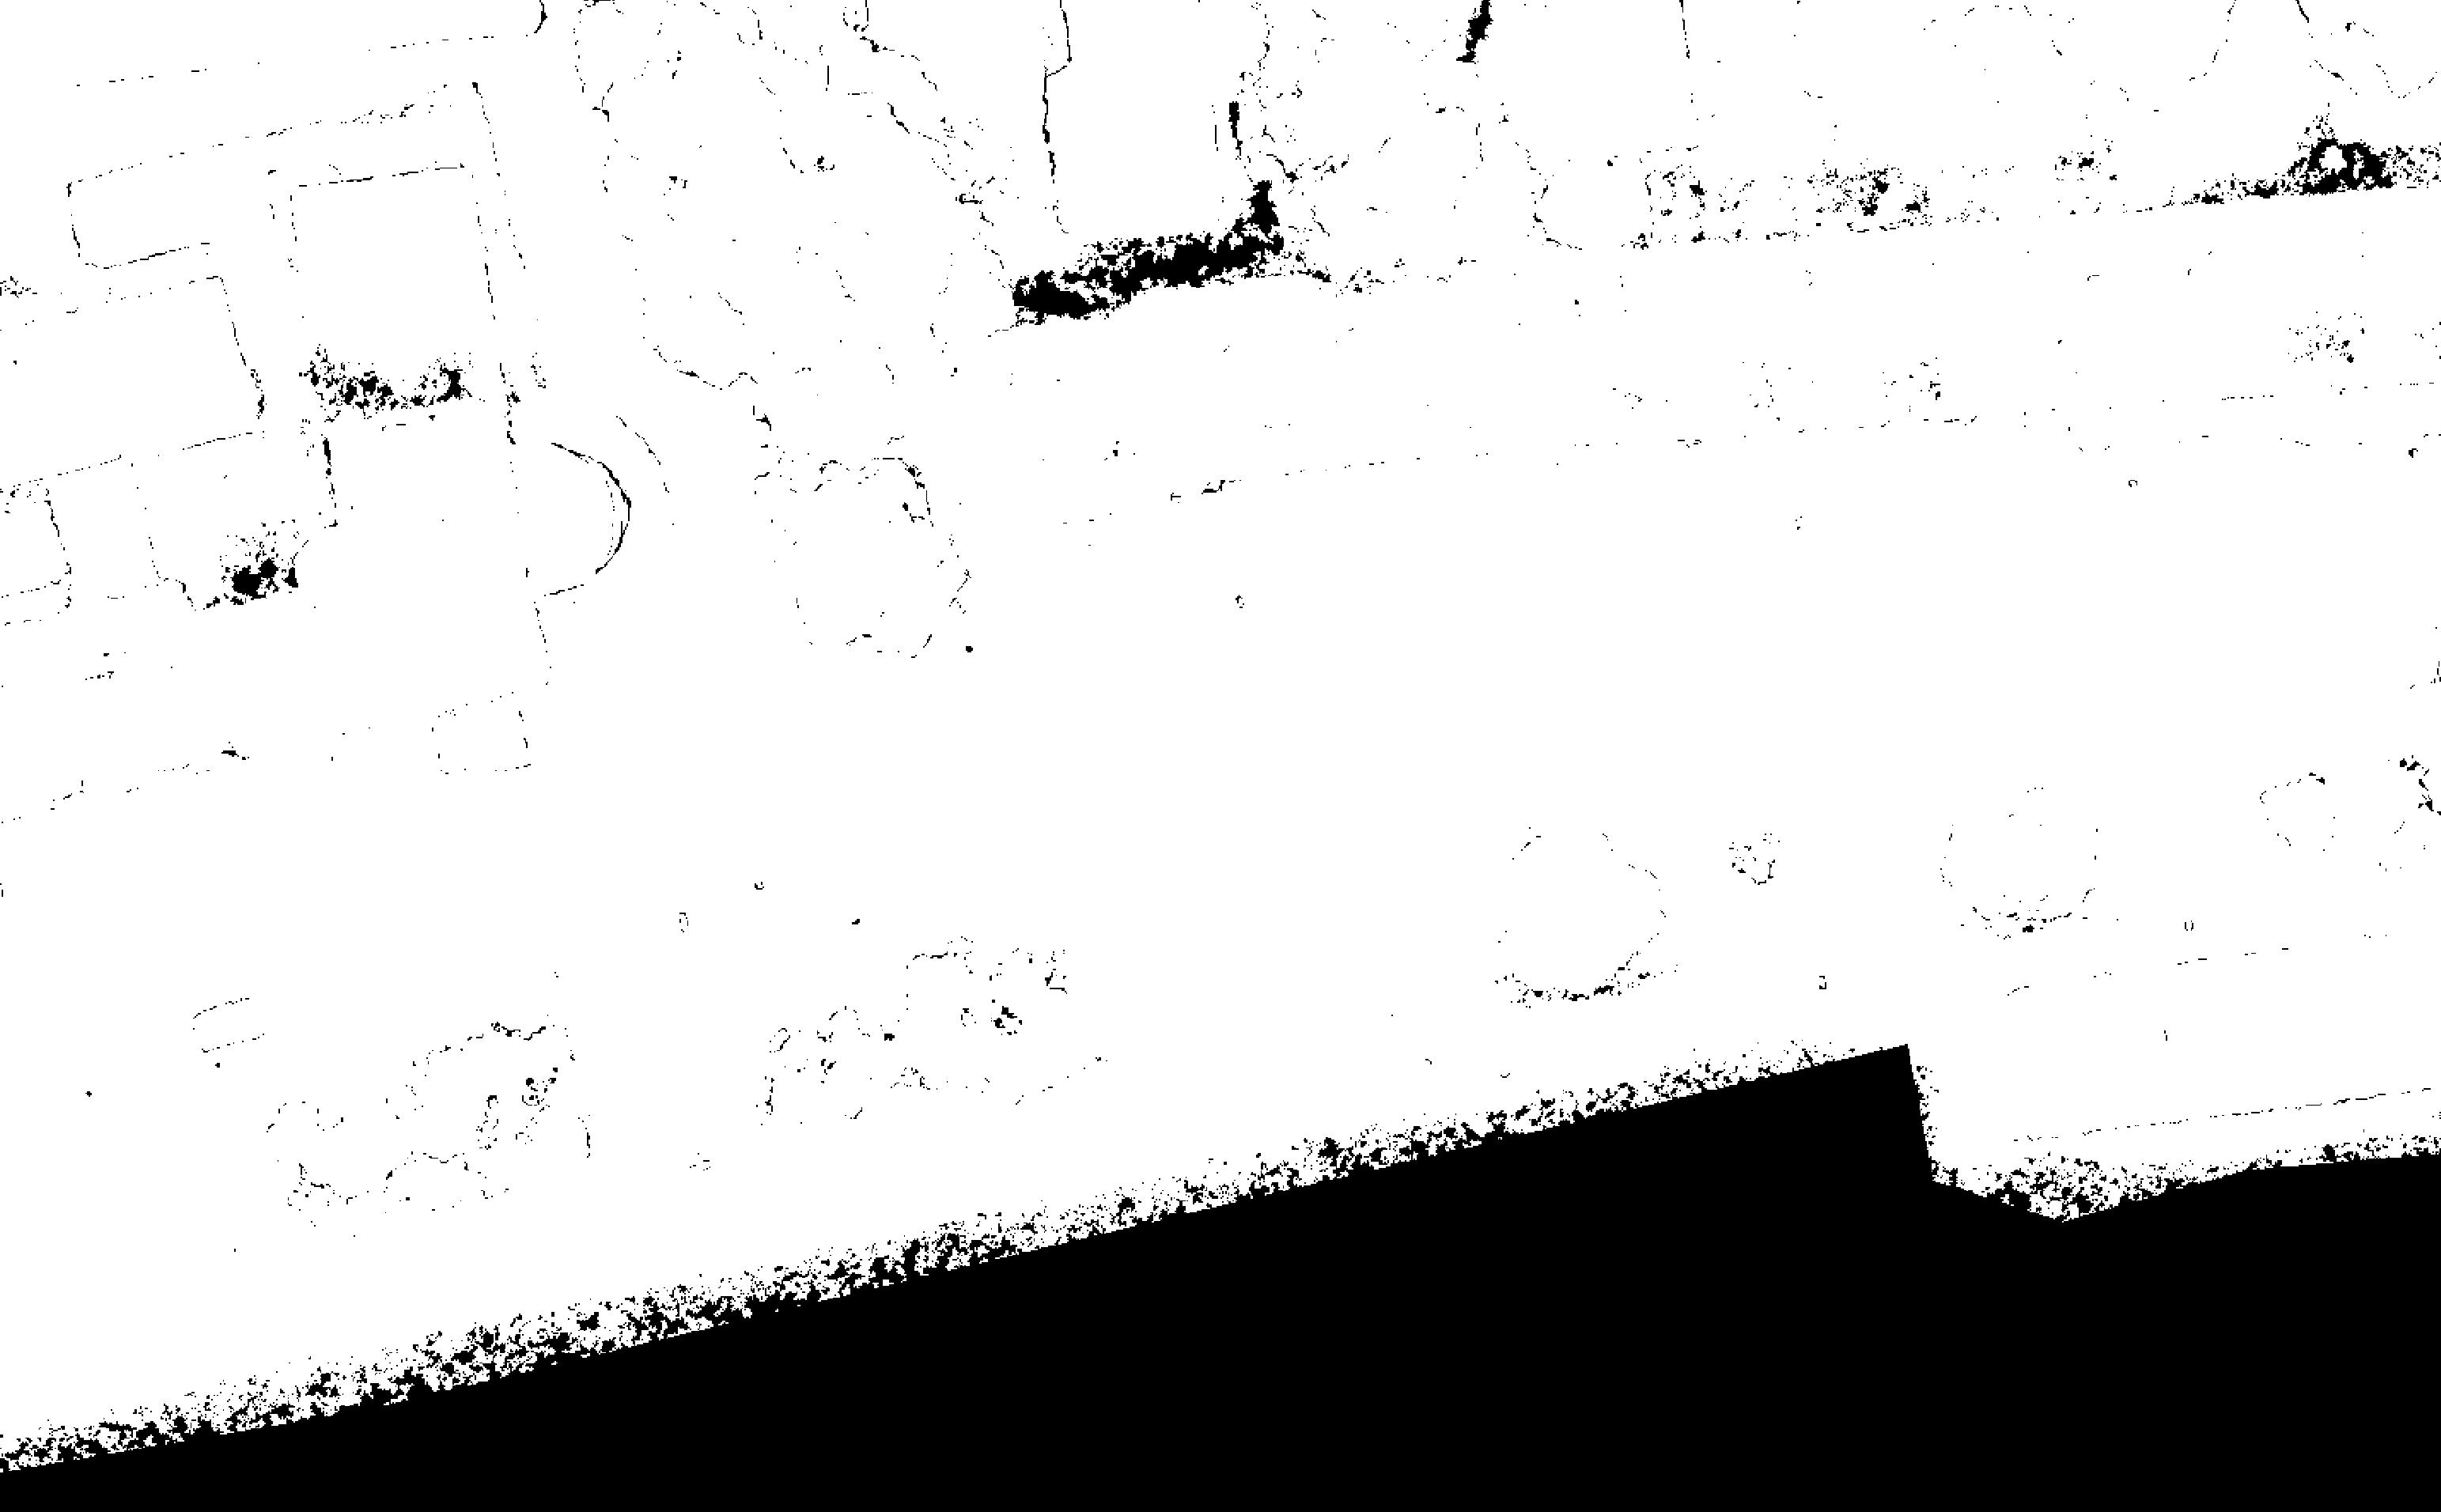
DSM Binary Mask
Pixels with an actual height measurement are represented as white (i.e., 255 or maximum intensity), whereas the interpolated or empty pixels are represented as black (i.e., 0 or minimum intensity).
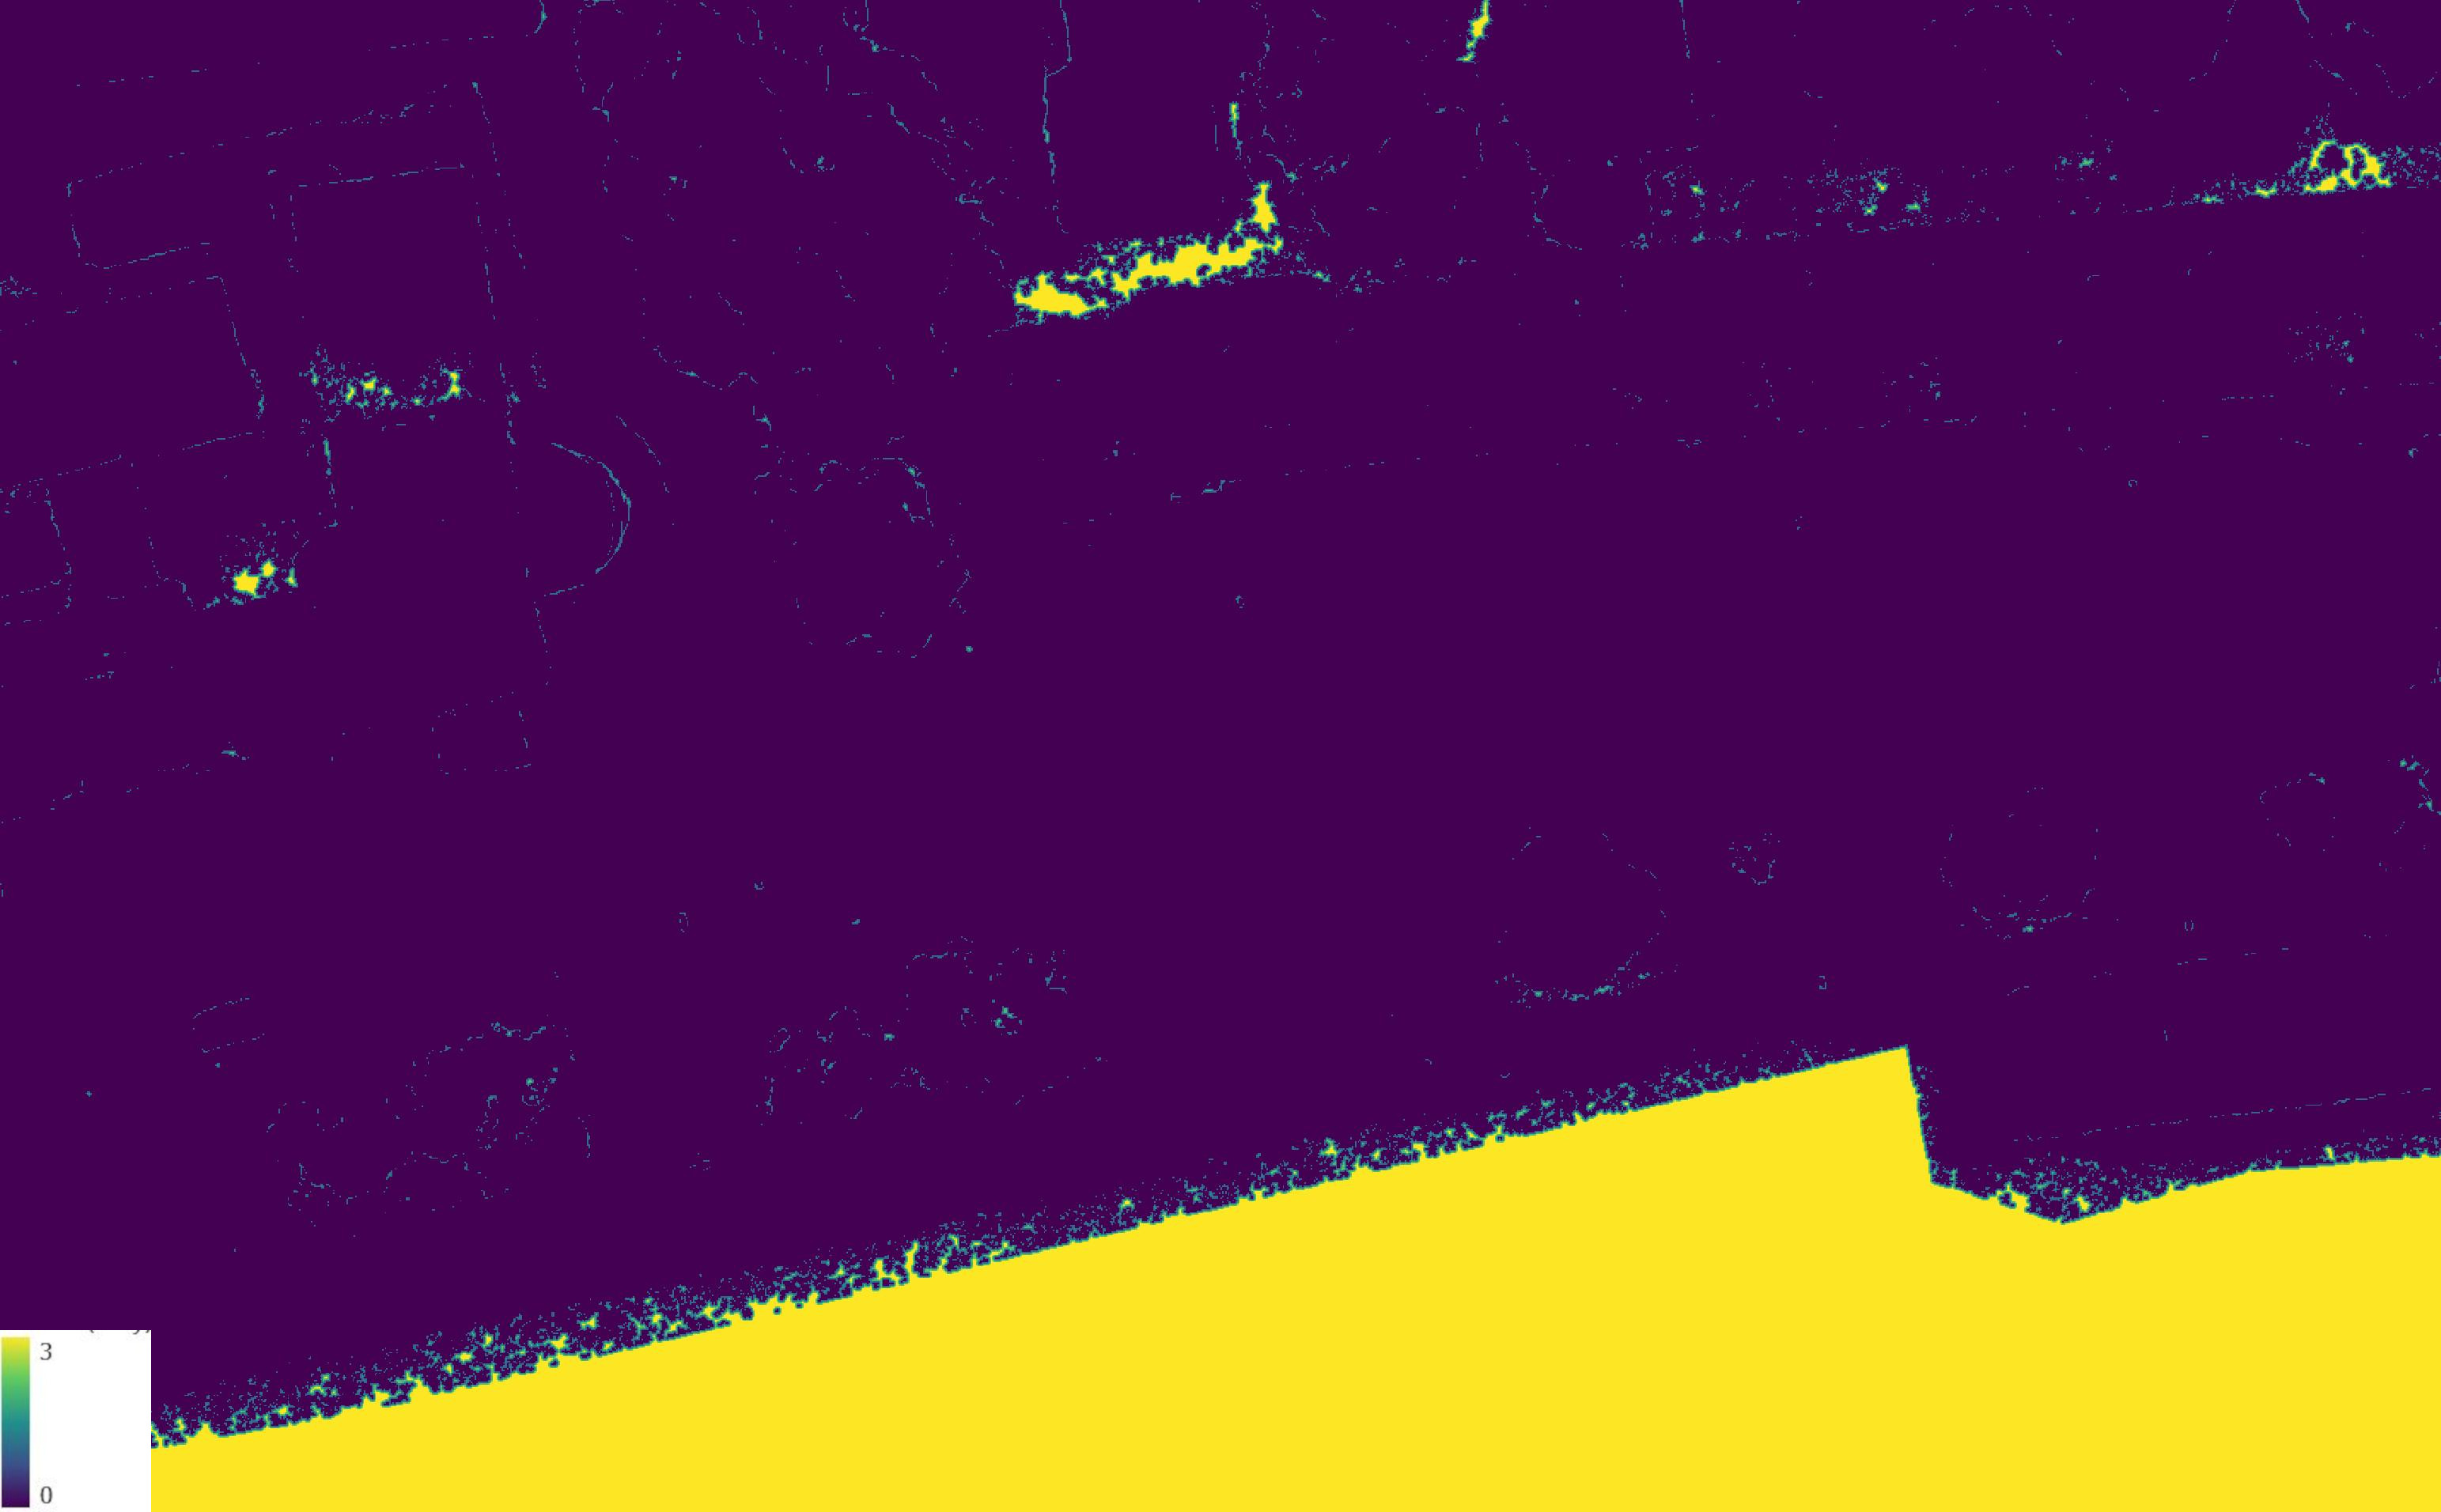
DSM Distance Mask
For each raster cell of the DSM that does not contain a measurement (including interpolated pixels), the euclidean distance to the closest pixel with a valid measurement (originating in a 3D point) is stored.